-
Notifications
You must be signed in to change notification settings - Fork 2
Help
Welcome aboard!
Installer download link, installation procedure and Release Notes are all available in the latest Release.
Installation procedures are release specific, so please refer to the Release Notes of the version you just downloaded.
Right after the installation is complete, there will be an ezAdmin account created with Administrative access (member of the Admin Role). Only users member of a privileged Role can create/update/delete other users and Roles.
It is a good practice and very advised to create at lease one more user (typically ezUser), and make it/them member of the User Role. See below for instructions.
Then use this user to do the day-to-day operations.
Please refer to the Release Notes of the version you downloaded/installed for any know bug, issue and limitation.
When logging for the first time, there will be no Open Collector nor Pipelines. You will need to:
- Create an Open Collector host
- If required for your Pipeline collection, deploy an additional Shipper to this Open Collector
- Create a Pipeline
- Add its Collection Configuration
- Edit the Field Mapping
- Deploy the Pipeline to one or more Open Collectors
- Including, or not, the one you used for the Tail
The EZ Cloud client, or User Interface, is reached via HTTPS by default on por 8400 of the EZ Cloud Server (https://<your_EZ_Cloud_Server>:8400/).
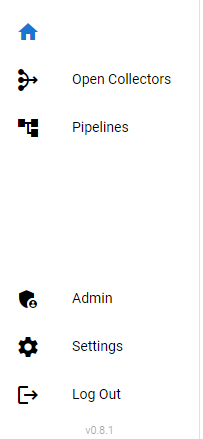
The menu bar is composed of three parts:
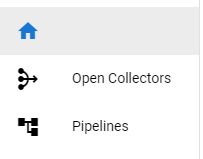
- top part, with links/buttons to:
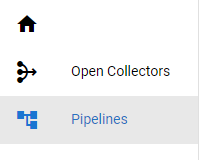
- Home
- Open Collectors
- Pipelines
- Middle part, with error indicators:
-
Socket disconnected error
- Only visible in case of problem
-
Socket disconnected error
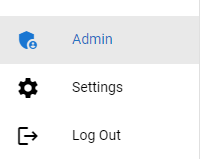
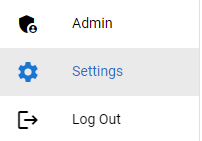
- Lower part, with links/buttons to:
-
Admin
- Only available when logged in as a User member of a Privileged Role
- Settings
- Logout
-
Admin
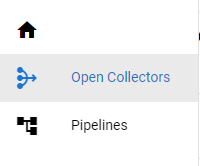
It is collapsed by default, and will expand when the mouse rolls over.
- Collapsed:
- Expanded:
Open Collectors are required for the user to be able to:
- Run temporary Tail to help mapping log source JSON data to LogRhythm SIEM's parsing tags and fields
- Deploy the Pipeline onto, for production
- In the menu, select Open Collectors
- List of Open Collectors:
From left to right:
-
Re-scan the Open Collector host to check presence and version of:
- Operating System
- Open Collector
-
Beats
- LogRhythm Beats, if running
- Other Beats, if installed
- During the scan, the waiting dots will be diaplayed in place:
- If the Open Collector host is not reachable, or credentials are incorect, this error will be displayed:
-
Edit the Open Collector's properties (name, host, port, credentials)
-
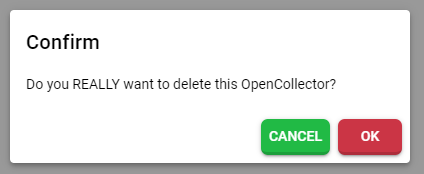
Delete the Open Collector
- Deletion attempts will be prompting the user to confirm:
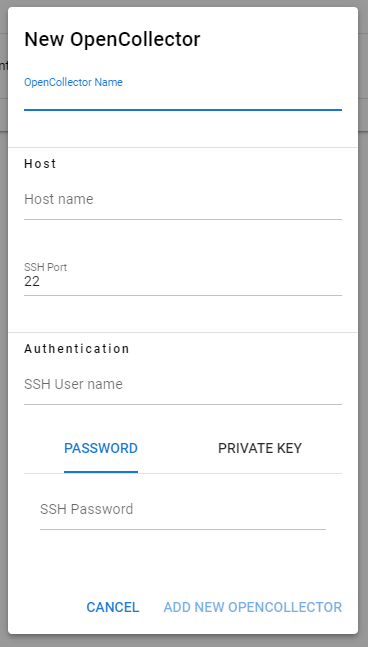
- Click on Add New OpenCollector button
- Enter the details on the Host in the form
- Enter the login of the user
- Select between Password or Private Key authentication method
- Provide the Password or Key in the corresponding field
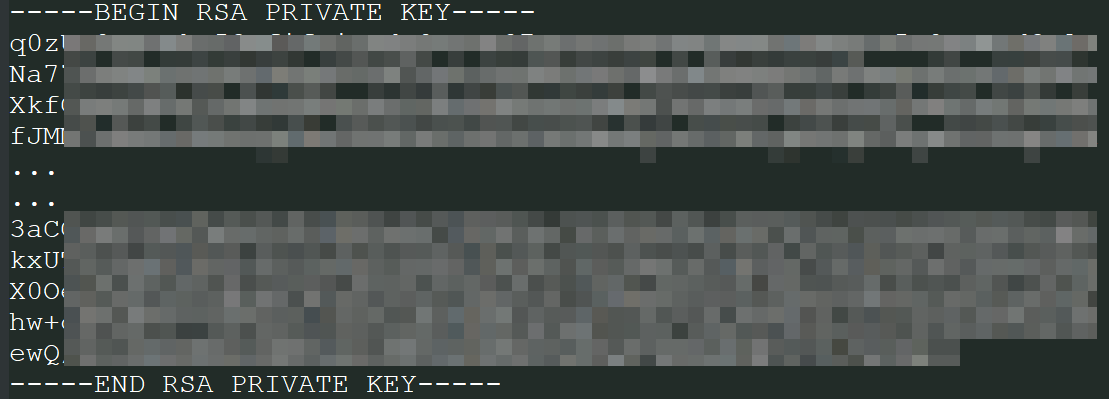
- For the Private Key, please do paste the whole content of the key file
- Including the
-----BEGIN... of the first line and ...KEY-----of the last line:
- Click Add New OpenCollector button
Shippers are used to collect the data from the Cloud or local sources.
LogRhythm Beats do already cover a lot of ground, but it's possible to use others too.
When an Open Collector is scanned for version, the list of the configured/running LogRhythm Beats as well as some other installed Beats is brought up with there respective versions:
Rolling over the icon with the mouse gives the name of the Beat:
Sometimes, it's necessary to deploy an extra Shipper on the Open Collector to be able to gather data over a protocol not already supported by the LogRhythm Beats.
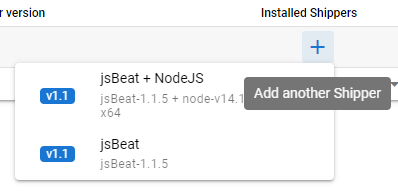
- For your selected Open Collector, click on the
+button under the Installed Shippers - Select the right Beat package you want to deploy:
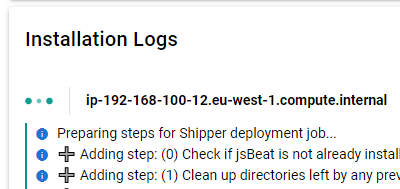
During the installation, the logs of the whole operation will be displayed in the lower part of the screen.
As multiple Shippers could be deployed on multiple Open Collectors, each deployment is tracked individually and the logs are grouped by the name of the targetted Open Collector:
While the installation is going on, the waiting dots will be diaplayed:
⚠️ IMPORTANT
Do not leave the page or close the web browser's tab while this is still ongoing, as you'll otherwise lose visibility on this deployment. Even if you come back to the same page later, the logs will not be visible any more.
The deployment will still carry on in the background, though.
If you come back later, you can force a new Re-Scan of the Open Collector (see Actions above)
Pipelines are effectively the Log Source project.
Each Pipeline:
- has a Collection configuration, that:
- decides which Beat to use to collect the data
- tells the selected Beat how to collect the said data
- has zero or more data fields mapped to LogRhythm SIEM tags/fields
- so bit of the data are mapped (parsed) to LogRhythm MDI fields
- these will be used to build the JQ Filter and JQ Transform for the Open Collector
- can be deployed to Open Collector hosts
- In the menu, select Pipelines
- List of Pipelines:
From left to right:
- Open the Pipeline properties
-
Edit the Pipeline details
- Name
- Primary Open Collector
- Status
-
Delete the Pipeline
- Deletion attempts will be prompting the user to confirm
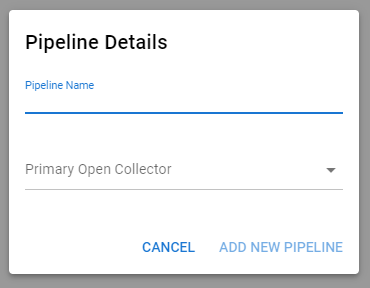
- Click on Add New Pipeline button
- Enter the details on the Pipeline in the form
- Pipeline's name
-
Pipeline's Primary Open Collector
- This Primary Open Collector will be used during Field Mapping to run temporary real-time Tails
- Click Add New Pipeline button
This displays the current:
-
Collection configuration
- Beat / Shipper used
- Collection method (Flat file, REST API, etc...)
- This is dependent on the selected Shipper capabilities
- Shipper's configuration
- Either YAML or JSON, depending on the selected Shipper requirement
- Mapping statistics
- Deployments list
Each of these sections have their own actions on the far right hand side.
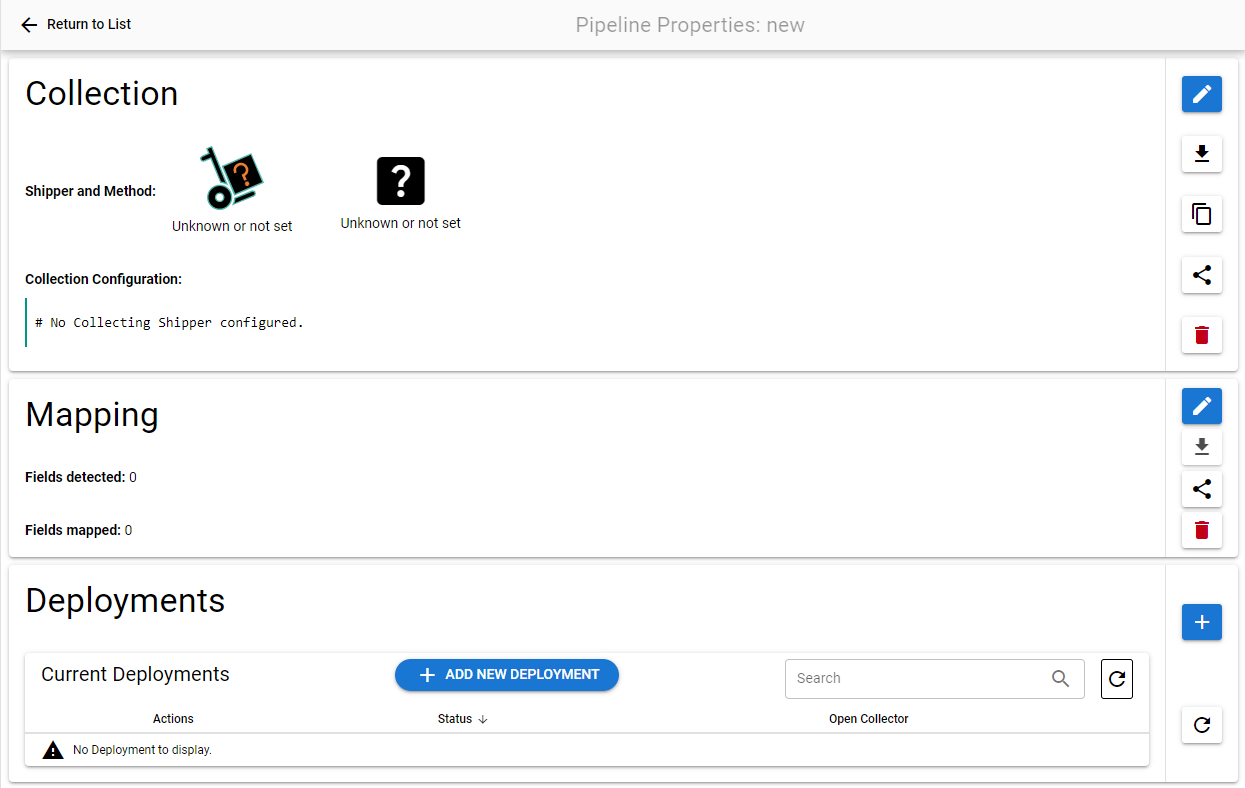
Properties page for a new yet unconfigured Pipeline:
From top down:
-
Edit the Collection Configuration
- See Adding / Editing Collection Configuration Help section.
- Download the Collection Configuration as a Shipper configuration file
- Copy the Collection Configuration in Shipper's format to the Clipboard
-
Share / Import the Collection Configuration as an EZ Cloud Collection Configuration file format
- See Sharing / Importing Collection Configuration Help section.
-
Delete the Collection Configuration
- Deletion attempts will be prompting the user to confirm
- Click on the pen icon on the top of the right hand side Action bar:
- Select the Collection Shipper and Collection Method
- Click the OK button
- Familiarise yourself with the different groups of Collection Parameters
- By default, the Required group of Collection Parameters, which is always the one at the top of the list, is already expanded:
- Fill in all the fields that are required, as well as all the ones that are relevant to the Pipeline you are configuring.
- Hit the *Save button in the navigation bar:
- Hit the Return to Properties button in the navigation bar when the configuration is complete.
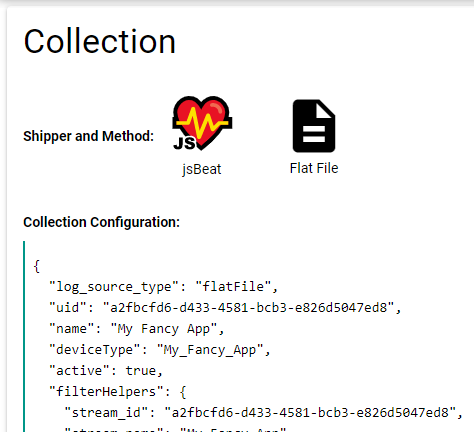
Once back to the Pipeline Properties page, the Collection panel should now be populated with the full details of the configuration.
The Collection panel of a configured Pipeline:
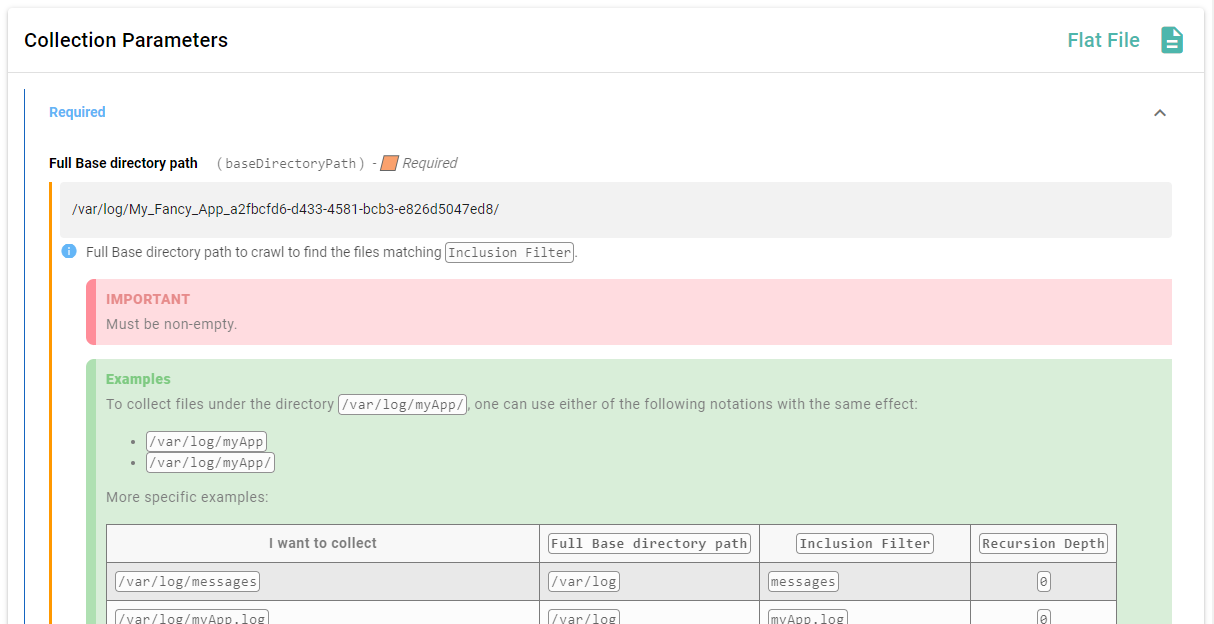
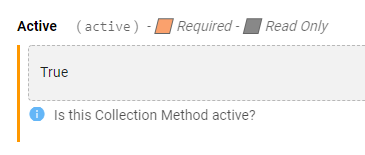
Required fields are flagged with two visual markers:
- an orange icon and the word Required on the right of the parameter's name line
- an orange vertical bar on the left of the whole parameter block
Example of a Required field:
ℹ️
NOTE
Certain fields are marked as Required outside of the Required group of Collection Parameters.
These are only required inside of the Collection Parameters they are in. For example, if you are not using a feature related to group of Collection Parameters, you do not need to worry about the fields within, including the ones flagged as Required.
Read Only fields are flagged with a signle visual marker:
- a grey icon and the words Read Only on the right of the parameter's name line
Example of a Required and Read Only field:
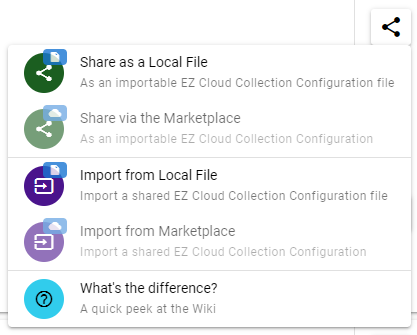
- Click on the share icon in the right hand side Action bar
- Select your preferred way to Share or Import the Collection Configuration
- See below for more details.
ℹ️
NOTE
During the Import, the identifiers contained in the Collection Configuration will be transformed to be based on the ones of the Pipeline (
UID,name, etc...) it is imported into.
What are the difference between the different ways of sharing and importing a Pipeline Collection Configuration
When sharing and importing a Collection Configuration, it's possible to do so in several ways, depending on your preference:
- Via a simple JSON File
- Via the Marketplace
See below for details about each.
Sharing via file will download locally a JSON file containing the Collection Configuration.
This file can then be imported in any other Pipeline, either on the same EZ Cloud Server or on any other one.
ℹ️
NOTE
This is not yet available.
From top down:
-
Edit the Field Mapping
- See Adding / Editing Fields Mapping Help section.
- Download the Field Mapping
-
Share / Import the Field Mapping as an EZ Cloud Mapping file format
- See Sharing / Importing Fields Mapping Help section.
-
Delete the Mapping
- Deletion attempts will be prompting the user to confirm
- Click on the pen icon on the top of the right hand side Action bar:
- Click Start Live Tail in the navigation bar:
- Wait for the log data to load. This can take a few seconds to minute as it needs to:
- Build the configuration for a temporary Shipper
- Start a temporary Shipper
- Shipper collects data
- Familiarise yourself with the different fields and data structure of the incoming logs, and their respective frequency
- Roll over the mini frequency graph to get the full details. The bars represent (from top down):
-
Relative Frequency: how many times have we seen this field, in relation to the most common field. For example:
- The most common field, will have a full bar (100%), even if it only occurs in a small sub-set of the whole log sample
- A field showing about half as often as the most common field, will show with a half bar (50%)
-
Absolute Frequency: how many times have we seen this field in the whole log sample
- Note that when loading Field Mapping from the Pipeline configuration, as opposed to running a Live Tail, the Absolute Frequency will be
N/Aand the bar will be full (as if it was 100%). This is because the full log sample is not saved as part of the Field Mapping, thus when reloading later on, there is no way to offer a meaningful statistic. For example:
- Note that when loading Field Mapping from the Pipeline configuration, as opposed to running a Live Tail, the Absolute Frequency will be
- Roll over the mini frequency graph to get the full details. The bars represent (from top down):
- Roll over the fields to display:
- The variety of the values
- Their type
- Their respective frequency:
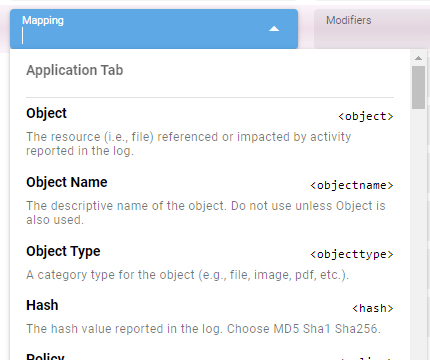
- For each field of interest, pick a LogRhythm SIEM field in the Mapping drop down list
- The list is searchable by any word contained in:
- the field name (for example:
Vendor Message ID)- displayed in bold on the top left of each item in the list
- the field tag (for example:
vmid)- displayed in between brackets on the top right of each item
- the field description (for example, for the VMID:
Specific vendor for the log used to describe a type of event.)- displayed in grey at the bottom of each item
-
For illustration, the
VMIDfield item in the list:
- the field name (for example:
- Optionnaly select one or more Modifier from the Modifiers drop down list
- Once the Mapping* is complete, hit the Save button in the navigation bar
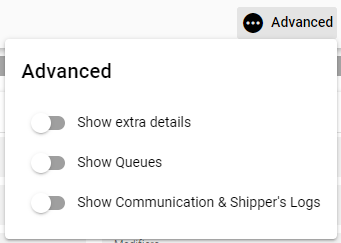
Placed the right hand side of the navigation bar, the Advanced menu offers a few options:
Most notably the Show Communication & Shipper's Logs, which will display the log trail of the Shipper at the very bottom of the page.
💡
HINT
If no logs are coming in after you started the Live Tail (let say after 20 or 30 seconds), it's a good idea to look at the Shipper's logs and scout for any potential error messages like:
- Access denied to the URL or file
- Authentication issues
- Timeouts
- Rate limiting error
- etc...
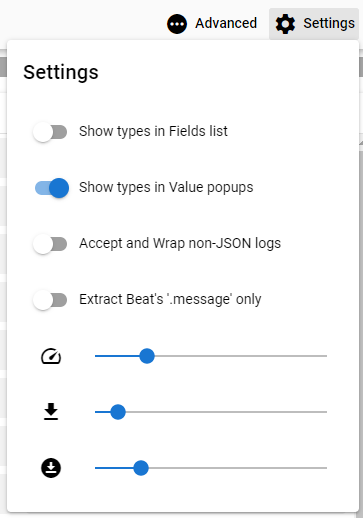
Placed the right hand side of the navigation bar, the Settings menu offers a few options:
Most notably:
-
Accept and Wrap non-JSON logs
- Will wrap any non properly formatted JSON data into a fictious JSON field
- If you need this, that means that the Open Collector will NOT be able to process these logs, as only properly formatted JSON entries can be processed
- This option is best used to bypass the JSON format verification and see what non-JSON data we are receiving from the Shipper
-
Extract Beat's '.message' only
- This option is sometimes necessary for some beats that wrap non-JSON data in a
.messageJSON entry - Typical examples:
- jsBeat
- FileBeat
- This needs to be turned ON before processing incoming logs, as any logs coming before will not be re-processed
- This option is sometimes necessary for some beats that wrap non-JSON data in a
-
Background Process maximum processing frequency (slide bar)
- Defines how fast the incoming logs are processed by the EZ Cloud client
-
Max messages in Queue (slide bar)
- How many incoming message will be accepted and queued for processing
- When the set number of logs have been received, the Live Tail will automatically stop
- Any incoming logs still in transit at this stage will simply be ignored
-
Max messages in Processed Logs (slide bar)
- How many messagefrom the incoming queue will be processed
- When the set number of logs have been processed, the Background Process will automatically stop
- Any logs still in the incoming queue will simply be left there unprocessed
It's possible to bring some log sample manually. To do so:
- Click Manual Import in the navigation bar:
- Select the most adequate import method to get your log sample processed correctly:
-
Single Log
- Will accept a single JSON object representing a single log, see below for more details
- click the Add to Queue button to import the log:
-
Multiple Logs
- Will expect a Set of Logs separated by a Carriage Return, see below for more details
- click the Add to Queue button to import the log:
-
File Import
- Will expect one or multiple files, and will process them depending on the import format selected in the menu, see below for more details
- click the Add to Queue button and select the right import method to process the file(s):
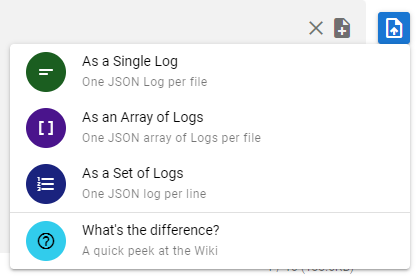
When importing logs sample from a File, it's possible to do so in several ways, depending on how the sample file is organised:
- As a Single Log per file
- As an Array of Logs per file
- As an Set of Logs
See below for details about each.
This is only valid if the sample file contains a single log.
ℹ️
NOTE
It's independent on how the log itself is formatted.
Good examples:
- Compact format:
{"timestamp":"20210422T16:40:00","id":"abcdef-1234"}- Spaced/tabbed format:
{
  "timestamp":"20210422T16:40:00",
  "id":"abcdef-1234"
}- Mixed format:
{
  "timestamp":"20210422T16:40:00", "id":
"abcdef-1234"
}This is only valid if the sample file contains a single Array of one or more logs.
ℹ️
NOTE
It's independent on how the array and logs themselves are formatted.
Good examples:
- Compact format:
[{"timestamp":"20210422T16:40:00","id":"abcdef-1234"},{"timestamp":"20210422T16:43:00","id":"xyzmno-8754"}]- Spaced/tabbed format:
[
  {
    "timestamp":"20210422T16:40:00",
    "id":"abcdef-1234"
  },
  {
    "timestamp":"20210422T16:43:00",
    "id":"xyzmno-8754"
  }
]- Mixed format:
[{
    "timestamp":"20210422T16:40:00","id":"abcdef-1234"
  },
  {"timestamp":
"20210422T16:43:00",
    "id":"xyzmno-8754"}
]This is only valid if the sample file contains a set of one or more logs, each written on a separate line. Put in another way: a set of Carriage Return separated single logs.
⚠️ IMPORTANT
It's very dependent on how the logs are formatted:
- no more than one log per line
- no less than one log per line 😅
- empty lines will be ignored
- each line must be a proper JSON entry
- improperly formatted JSON entries will be ignored
- each line must be separated by at least a Carriage Return character (
\raka CR aka ASCII #13)
- Line Feed characters (
\naka LF aka ASCII #10) will be blissfully ignored
Good examples:
- Compact format:
{"timestamp":"20210422T16:40:00","id":"abcdef-1234"}
{"timestamp":"20210422T16:43:00","id":"xyzmno-8754"}- Spaced format:
{ "timestamp": "20210422T16:40:00", "id":" abcdef-1234" }
{ "timestamp": "20210422T16:43:00", "id": "xyzmno-8754"}- Mixed format:
{ "timestamp": "20210422T16:40:00", "id":" abcdef-1234" }
{"timestamp":"20210422T16:43:00","id":"xyzmno-8754"}- Click on the share icon in the right hand side Action bar
- Select your preferred way to Share or Import the Mapping
- See below for more details.
ℹ️
NOTE
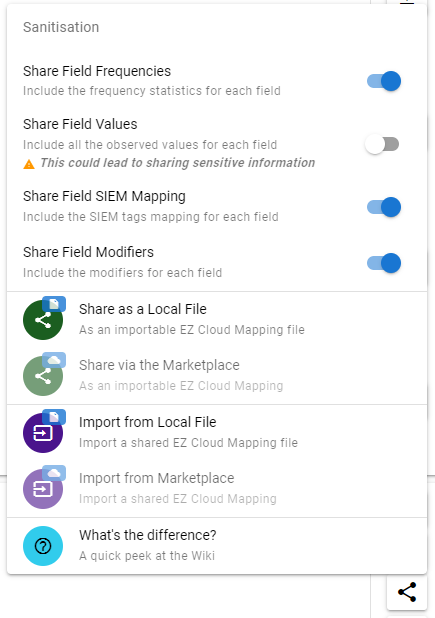
Please pay attention to the Sanitisation options prior to Sharing anything with third parties.
When sharing and importing a Mapping, it's possible to do so in several ways, depending on your preference:
- Via a simple JSON File
- Via the Marketplace
- Optionally Sanitising some or all parts of the Mapping prior to Sharing
- Field's Frequencies
- Field's Values
- By default and highly recommended, to avoid sharing sensitive information
- Field's SIEM Mapping, if any
- Field's Modifiers, if any
See below for details about each.
Sharing via file will download locally a JSON file containing the Mapping.
This file can then be imported in any other Pipeline, either on the same EZ Cloud Server or on any other one.
ℹ️
NOTE
This is not yet available.
You might not want to share some of the details you collected or configured in the Mapping.
Most importantly, the fields' Values, as these could reveale sensitive information.
Default values:
| Sharing | Default | Exported value(s) if Sharing is Disabled |
|---|---|---|
| Frequencies | Enabled | 1 |
| Values | Disabled | None (empty array) |
| SIEM Mapping | Enabled | None |
| Modifiers | Enabled | None |
🚧
🚧
🚧
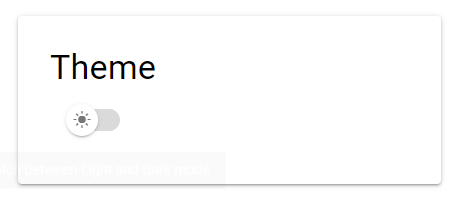
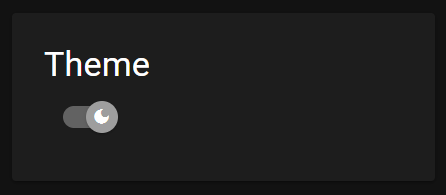
- In the menu, select Settings
- Flick the selector to enable or disable the Dark mode:
If you found a mistake, have a suggestion, want to help/contribute, or cannot find what you were looking for, please get in touch and raise an Issue.

