Debugging WebRender
- Links
-
Tools
- Overlay debugging
- Wrench
- Wrench in headless mode with os-mesa
- WebRender debug server
- Apitrace
- RenderDoc
- Shader debugging with Renderdoc
- PIX
- Mesa environment variables (Linux)
- LPGPU2
- Event tracing for Windows (ETW)
- Profiling with the Gecko profiler
- Binary recording
- Capture infrastructure
- Tile view
- Chasing infrastructure
- GPUView
- GPU vendor tools
- "Show Overdraw" mode
- DirectComposition
- GPA
- ThinCast
- Tracy
- Shaders
(This TOC is created manually, please add new anchors if you add sections -- thanks).
These are a few useful resources for hacking on WebRender.
- https://github.com/servo/webrender/wiki — high-level description of the architecture
- https://github.com/servo/webrender/issues — bug list; feel free to comment if you're interested in helping out with something
- https://air.mozilla.org/bay-area-rust-meetup-february-2016/ — talk explaining WebRender from a birds'-eye view
- https://github.com/servo/webrender/issues/3070 — step-by-step investigation of the plane splitting precision issue
- https://open.gl/ — modern OpenGL tutorial
- https://www.opengl.org/wiki/ — very useful resource for exhaustive explanations of OpenGL features
- The chromium/blink developers already try to use the gpu for drawing, see here some documentation of their implementation.
Here is a list of useful tools to work on or with WebRender.
The RendererOption struct has a set of flags that can be set to enable displaying various debugging information on top of the rendered content. These can be toggled with keyboard shortcuts when running wrench or the examples (See the keyboard input handling code in wrench/main.rs).
In Firefox the integrated profiler overlay can be enabled via the pref gfx.webrender.debug.profiler. The content displayed by the profiler depends on the profiler ui string defined by the gfx.webrender.debug.profiler-ui pref. The profiler ui string syntax is explained at the top of profiler.rs. It allows selecting what information to show and laying it out on screen in rows and columns.
By default counters are shown as average and max values over half a second. When prefixed with "#", a counter will be show as a graph, and when prefied with "*", a counter is shown as a change indicator. For example the "Rasterized glyphs" counter is only set when some glyphs are rasterized, so one can write "*Rasterized glyphs" in the profiler ui string to see when it happens, while "#Rasterized glyphs" will plot the number of rasterized glyphs over a number of frames in a graph.
There are multiple presets (see PROFILER_PRESETS in profiler.rs) showing more or less content (and occupying more or less screen real estate). For example the Default preset shows a lot more than the Compact one. None of the presets show all counters. Look at the list of counters defined in profiler.rs.
To work properly, some counters need the "gfx.webrender.debug.gpu-time-queries" or "gfx.webrender.debug.gpu-sample-queries" prefs to be enabled (Disabled by default because of performance overhead).
WebRender debugging and testing tool:
- Live-editing of scenes described in yaml files.
- Replay WebRender recordings.
This tool is under the wrench directory in this repository.
cargo run -- --help in the wrench directory to see more information about how to use this tool.
For graphics debugging, the following options are useful:
---no-batch disables combining multiple items into instanced draw calls, which means every quad/item is drawn separately, and it's easier to see the side effects.
-
--angleon Windows enables Angle library, forcing D3D11 to be used for rendering. GPU tools work much better with D3D11, providing pixel history and shader debugging.
wrench can be run using the wrench/script/headless.py to get a software GL-context which matches what runs in CI and has the advantage of being compatible with rr.
The script uses an optimized build by default, but a debug build can be used instead by setting the OPTIMIZED environment variable to "false" or "0". headless.py also provides the option of running in a debugger by setting the DEBUGGER environment variable to "gdb", "cgdb", "rust-gdb", or "rr".
For example: OPTIMIZED=false DEBUGGER=rr ./script/headless.py rawtest
(This tool was removed in 2021, as it wasn't being maintained.)
When compiled with the "debugger" feature flag, WebRender starts up a debug server that can be accessed with a browser. The web interface allows toggling overlay debugging information and visualizing useful information such as the display list, and batches.
example:
# go to wrench's directory
cd wrench
# show one of the test files with the debug server enabled
cargo run -- show reftests/image/tile-size.yaml
# show the web interface
firefox ../debugger/index.htmlWorks out of the box.
Project page: https://github.com/apitrace/apitrace
Traces can be converted to C++ using https://github.com/jrmuizel/apitrace/tree/tocpp
Project page: https://renderdoc.org/
Works out of the box (almost). Allows inspecting the graphics state and individual draw calls. Doesn't provide shader debugging or pixel history on OpenGL. See this page for ANGLE specific tweaks that may be necessary.
On windows, start firefox with the --wait-for-browser command-line option. Otherwise the launcher process starts firefox and terminates right away which RenderDoc understands as the program terminating before anything interesting happened.
Sometimes Firefox is successfully launched from renderdoc but the connection closes (timeout) before you get a chance to capture a frame in renderdoc. If this happens, it is still possible to re-attach to the Firefox process by selecting File > Attach to running instance in renderdoc.
Firefox's sandboxing can cause content processes to crash when renderdoc tries to attach to them. If this happens, set the MOZ_DISABLE_CONTENT_SANDBOX environment variable to 1 via renderdoc's application launch configuration.
On Windows these may also help:
-
gfx.webrender.enabled-no-gpu-process-with-angle-winto true, and -
browser.launcherProcess.enabledto false; - renderdoc can't see frames when rendering to DirectComposition, so disable it via
gfx.webrender.compositor= false;
Renderdoc supports debugging shaders with D3D on Windows.
Running a debug build of wrench with the --angle option makes it possible to use Renderdoc's pixel history feature and step into the HLSL version of the shaders which, while not being the original GLSL source, is a lot easier to step through than the shader assembly available in release builds.
Project page: https://devblogs.microsoft.com/pix/download/
Works for wrench via angle and d3d11 on 12. Add --angle in wrench's command-line parameters.
Mesa provides some useful environment variables, for example INTEL_DEBUG=perf adds performance logging to stdout.
See http://www.mesa3d.org/envvars.html for a comprehensive list.
Helpful to track down power usage on Android: https://github.com/codeplaysoftware/LPGPU2-CodeXL
The builtin event tracing infrastructure records a lot of information that can be viewed with Windows Performance Analyzer. The UI is everything but user-friendly, however it can be useful to diagnose GPU performance issues related to synchronization primitives or resource contention which are often hard to diagnose with other tools.
- https://docs.microsoft.com/en-us/previous-versions/windows/it-pro/windows-8.1-and-8/hh448229(v=win.10)
- https://docs.microsoft.com/en-us/windows-hardware/test/wpt/wpa-step-by-step-guide
WebRender in Gecko is compatible with the built-in profiling infrastructure, select the "Firefox Graphics" preset in the setting panel to profile the right threads and avoid the overhead of capturing screenshots. If you need to create a custom setting, the following threads are usually relevant to investigating WebRender performance:
- WRRenderBackend
- WRSceneBuilder
- WRWorker
- Renderer
You can copy and paste the following: GeckoMain,Compositor,WRRenderBackend,WRSceneBuilder,WRWorker,Renderer
To profile WebRender's startup, set the environment variables MOZ_PROFILER_STARTUP=1 and MOZ_PROFILER_STARTUP_FILTERS=Renderer,RenderBackend (Add any other thread name you need to profile during startup)
(This tool was removed in 2020, as it was untested and blocked some other work.)
WebRender allows dumping all incoming display lists in a binary file that can be re-played later, and individual frames can even be converted to YAML reftests. In order to use it from Gecko, it needs to be run with ENABLE_WR_RECORDING=1 environment variable.
WebRender has a debugging feature that serializes most of the internal state in a way that can be replayed in wrench (and inspected manually by looking at the generated text files in RON format).
This is integrated in Firefox Nightly and can be enabled by setting gfx.webrender.debug.enable-capture=true and used by pressing Ctrl + Shift + 3 (on some keyboard layouts this may be Ctrl + #). Upon hitting these keys a folder wr-capture will be created in the current user's home directory. If an existing capture is there, we'll append a suffix number like wr-capture.1, wr-capture.2, and so forth, to avoid overwrites.
Multi-account containers (an extension that is enabled by default) has a keyboard shortcut which conflicts with the one used for WebRender captures. To disable the conflicting shortcut, go to about:addons > click the gear icon > Manage Extension Shortcuts and make sure that Ctrl + Shift + 3 is not used by the extension.
To replay the capture in wrench, use the wrench load <capture-path> command.
Note: there isn't currently a way to convert WR captures into YAML testcases.
@kvark wrote some more info about the tool on their blog.
To successfully replay the captures it's currently required to turn off the native compositor and set gfx.webrender.max-partial-present-rects=0
(This tool was removed in 2021, as it wasn't being maintained.)
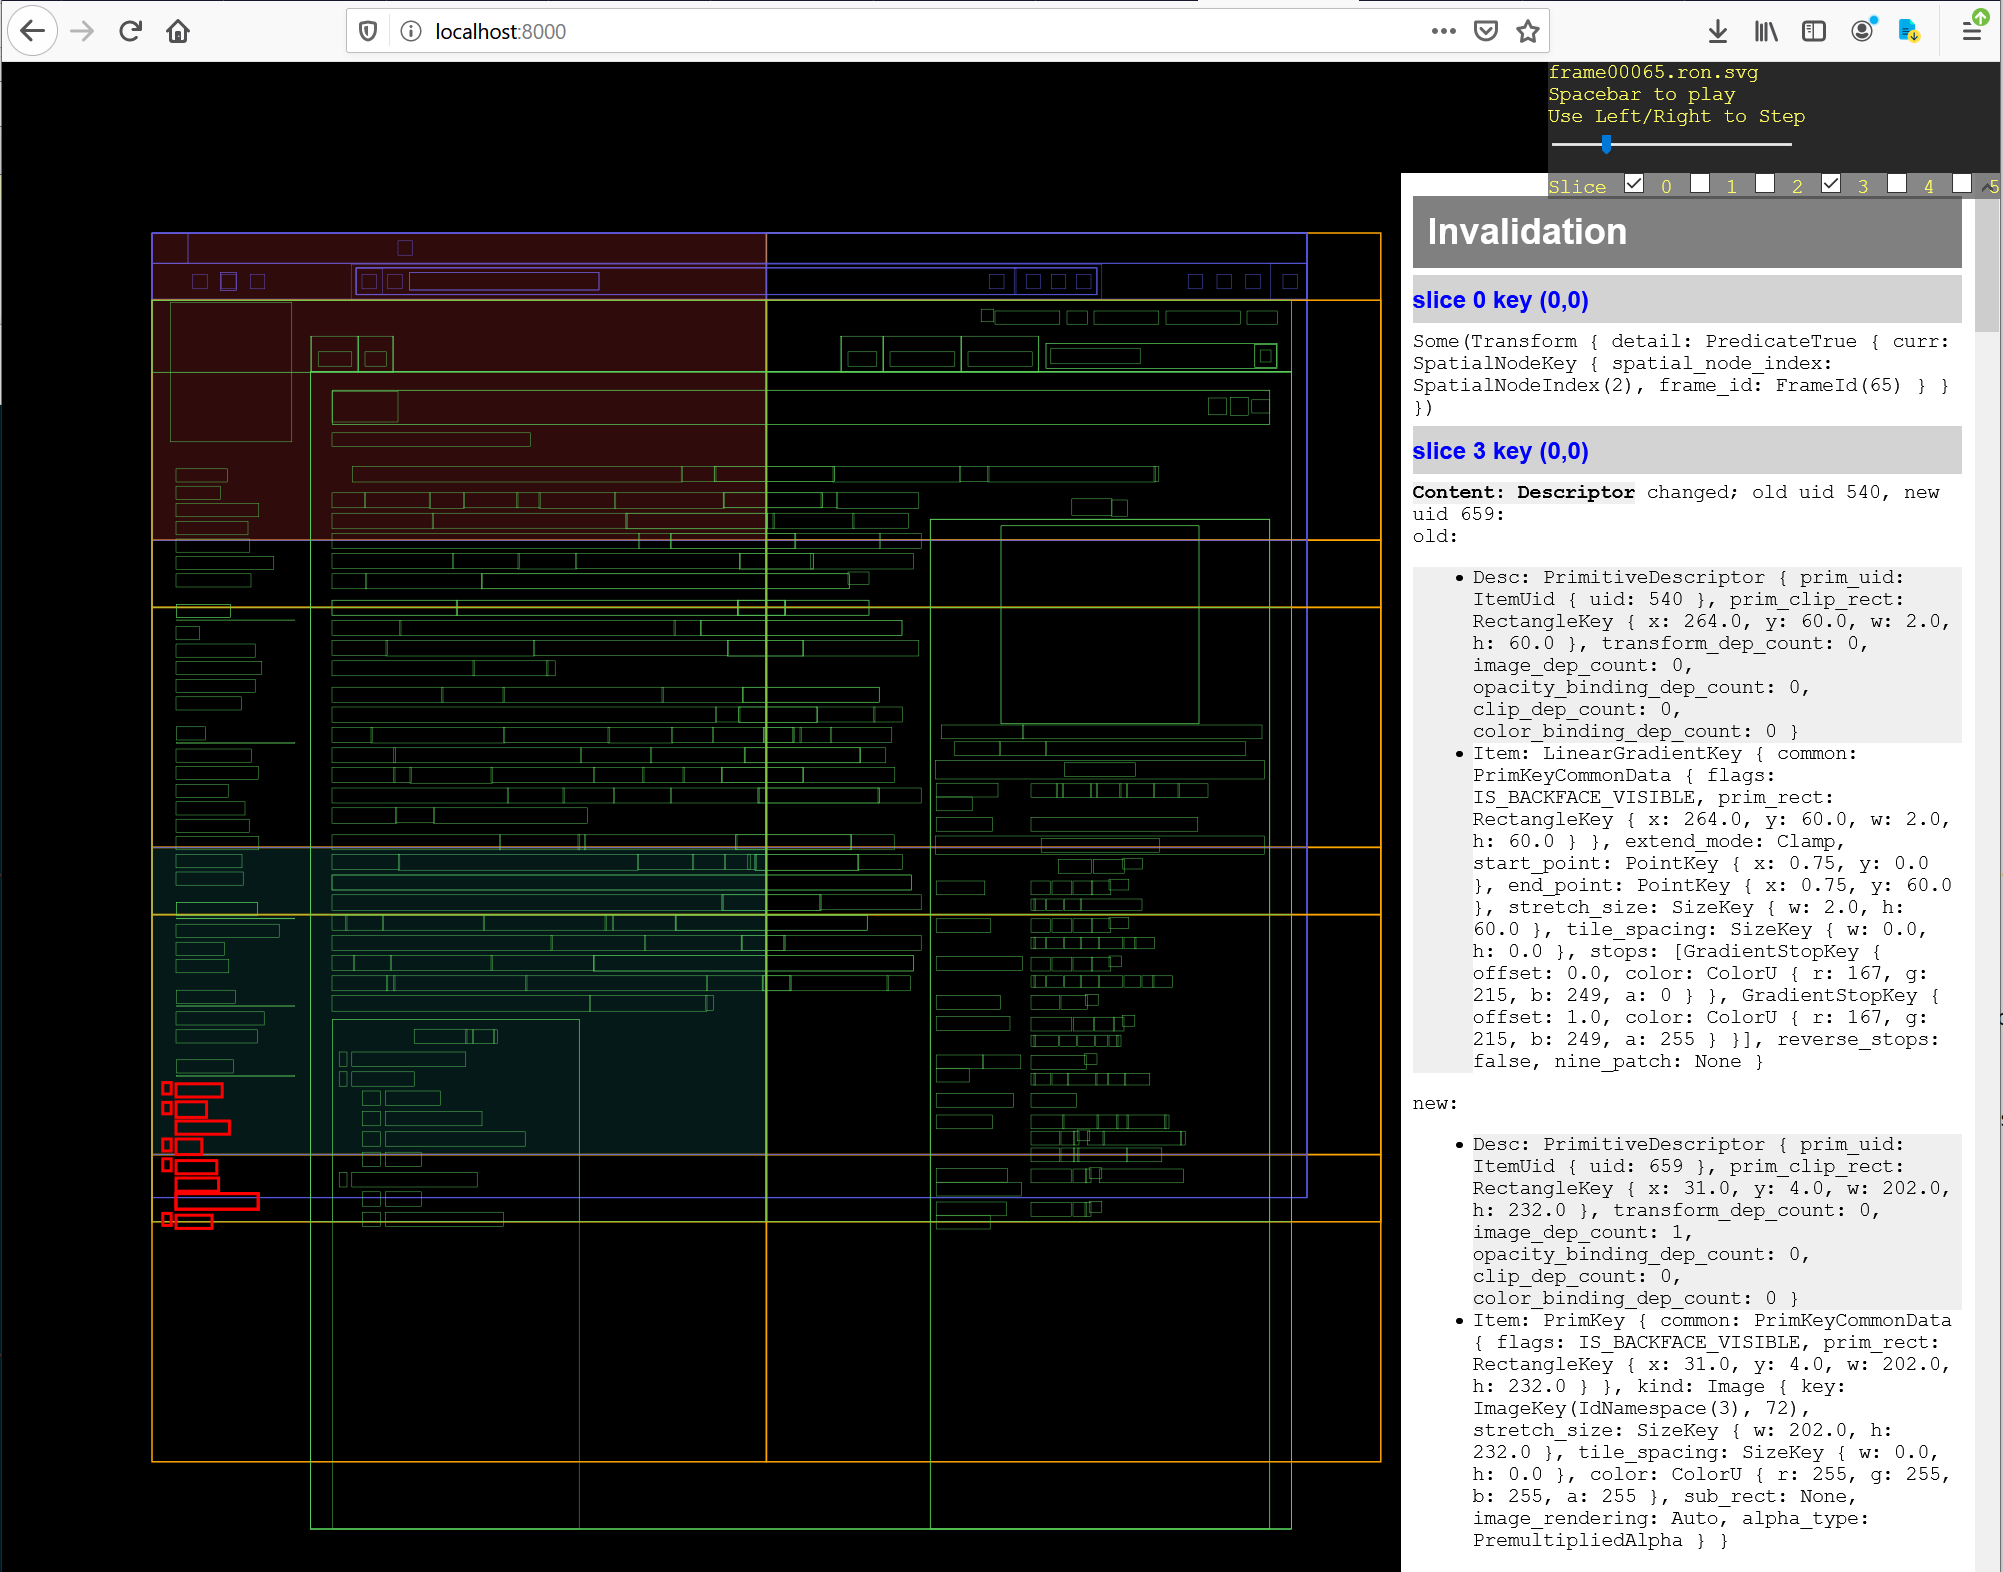
The tileview/ directory contains a command line tool to visualize picture cache tiles from a capture. It captures hundreds of frames of invalidation activity, so you can scrub the timeline to go back and inspect why the cache was invalidating.
First, capture by enabling webrender and enabling gfx.webrender.debug.tile-cache-logging. This will start recording into a circular buffer of (currently) 500 frames. The log records interning activity so that opaque intern-IDs can be converted back to readable descriptions. This however requires that the frame on which the primitive was interned is still available in this circular buffer. Thus a common workflow is to enable the logging flag, shut down the browser, and fire it up again with the page-to-be-investigated on the command line; then "quickly" repro the problem, and hit Ctrl-Shift-3 to get a wr-capture. This would guarantee that all relevant information is in the logs. If this is a bit too complicated or stressful to pull off reliably, the brute force method is to enlarge the buffer in a local build by just throwing lots of memory at it.
A single frame can easily be 500KB so it adds up very quickly when scrolling at 60FPS. Also, due to the size, saving the wr-capture takes some time. Meanwhile the UI locks up, so you can use the mouse to highlight chrome and when highlights start working again, the save is done. Don't press Ctrl-W or Alt-F4 as that may be processed asynchronously and you'll have an incomplete capture.
When done, you'll have a .../wr-capture/tile_cache folder with *.ron files. Next run (in gfx/wr/tileview):
cargo run --release -- /foo/bar/wr-capture/tile_cache /tmp/analysis
If it doesn't work, make sure your capture is complete, and make sure you added tile_cache/ to the input folder path.
You can use firefox /tmp/analysis/index.html to view the result; but some features require a server due to origin scripting limitations: python -m SimpleHTTPServer 8000 (from /tmp/analysis) and then open localhost:8000 instead.
For example, the checkboxes to toggle slice visibility need this.
The command line takes an optional scale parameter; and if you provide a scale, a further optional 2 numbers, an X and Y offset in pixels:
cargo run capture/tile_cache/ /tmp/foo 0.5
cargo run capture/tile_cache/ /tmp/foo 0.5 100 300
The main two uses are:
- compensate for DPI scaling. Capturing a browser at 150% DPI and doing a playback at 150% doesn't look right; use 0.6 scale to undo double scaling.
- shrink the view and shift it so you can see caching logic beyond the browser window -- how far ahead do we pre-render tiles? how long do they stay alive once scrolled out of view? Maybe also useful for APZ, desktop zooming.
While capturing allows you to see a slice of the whole state at a particular point in the pipeline, more often than not we are only interested in a single item. There is logic in place to "chase" the processing of an individual primitive.
If you have a WR capture saved in wr-capture, and you know the local rectangle of an item to track, you can edit wr-capture/backend.ron to enable chasing of a primitive with this rectangle:
    frame_config: (
        enable_scrollbars: false,
        default_font_render_mode: Subpixel,
        dual_source_blending_is_supported: true,
        dual_source_blending_is_enabled: true,
        chase_primitive: LocalRect(((2, -261), (217, 309))), // <--- here
    ),
Then you'd need to load the capture: cargo run -- --chase "2,-261,217,309" load ~/wr-capture. No changes are observed at this stage, because nothing is processed: the built frame is simply displayed. In order to re-build the frame from a scene you can hit a button (say, left/right). You'd see the following output on the console:
loaded [DocumentId(IdNamespace(5), 0)]
Chasing PrimitiveIndex(16)
        preparing a run of length 1 in pipeline PipelineId(1, 11)
        run ScrollNodeAndClipChain { spatial_node_index: SpatialNodeIndex(7), clip_chain_index: ClipChainIndex(21) }
        transform [1.0, 0.0, 0.0, 0.0, -6.1793494, -1.6343956, 0.9659258, -0.0064395056, -1.6557517, -1.4732112, 0.25881904, -0.0017254603, 16093.576, 4550.9814, -2524.7356, 17.831573]
        effective clip chain from CoordinateSystemId(2) (applied)
                CoordinateSystemId(2) TypedRect(1920.0?3200.0 at (0.0,-2443.7988))
                CoordinateSystemId(2) TypedRect(1920.0?340.0 at (0.0,0.0))
                CoordinateSystemId(0) TypedRect(1920.0?962.0 at (0.0,78.0))
                CoordinateSystemId(0) TypedRect(1920.0?255.0 at (0.0,194.0))
        updating clip task with screen rect TypedRect(2000000000?999999744 at (-1000000000,255))
        base screen TypedRect(1920?785 at (0,255)), combined clip chain TypedRect(1920?184 at (0,265))
        segment tasks have been created for clipping
        considered visible and ready with local rect TypedRect(1920.0?3200.0 at (0.0,0.0))
                BrushSegment { local_rect: TypedRect(1920.0?3200.0 at (0.0,0.0)), clip_task_id: RenderTaskId(RenderTaskId(4, FrameId(1))), may_need_clip_mask: false, edge_flags: LEFT | TOP | RIGHT | BOTTOM, extra_data: [0.0, 0.0, 0.0, 0.0], brush_flags: (empty) }
        task target TypedRect(1920?775 at (0,0))
        PrimitiveHeader { local_rect: TypedRect(1920.0?3201.0 at (0.0,0.0)), local_clip_rect: TypedRect(1920.0?340.0 at(0.0,2443.7988)), task_address: RenderTaskAddress(5), specific_prim_address: GpuCacheAddress { u: 456, v: 42 }, clip_task_address: RenderTaskAddress(32767), transform_id: TransformPaletteId(16777223) }
        source CacheItem { texture_id: TextureCache(CacheTextureId(0)), uv_rect_handle: GpuCacheHandle { location: Some(CacheLocation { block_index: BlockIndex(3412), epoch: Epoch(2) }) }, uv_rect: TypedRect(400?300 at (0,512)), texture_layer: 3 }
        Image(Texture2DArray) PrimitiveHeaderIndex(0), task relative bounds TypedRect(2000000000?999999744 at (-1000000000,-10))
Here you can get a lot of valuable info to use in conjunction with regular debugging or WR capture fiddling:
- primitive index
- list of clips affecting an item
- resulting local/screen rectangles
- primitive header passed to GPU
GPUView works quite well and is good for getting lots of information. You can add additional annotations to gpuview traces using ID3DUserDefinedAnnotation or IDXGIInfoQueue. ANGLE's debug implementation uses ID3DUserDefinedAnnotation.
GPUView uses regular Event Tracing for Windows infrastructure (see log.cmd). It's possible to load the resulting .etl files into Windows Performance Analyzer to get a hierarchical call stack of cpu usage using "CPU Usage (sampled)" analysis (inside "Computation").
To install and run gpuview:
- Download the Windows Assessment and Deployment Kit (Windows ADK) for Windows 10
- Open a command prompt as admin
- Go to the directory: C:\Program Files (x86)\Windows Kits\10\Windows Performance Toolkit\gpuview
- Start a trace by running log.cmd, and stop it by running log.cmd again.
- If your computer is using a non en-us locale, it's likely that log.cmd failed with an error 4000 message confusingly translated to your language. If so you will have to fix log.cmd as described in: https://www.yosoygames.com.ar/wp/2016/09/solving-gpuview-4000-was-unexpected-at-this-time-error/
- Once you have successfully captured a trace, the generated file with with all of the useful information is Merged.etl.
- Open it in gpuview, and try to make sense of its UI as much as you can.
To get GPUView (3.52.8.41) for Windows 7 you can use the Windows 7 SDK from here https://www.microsoft.com/en-ca/download/details.aspx?id=8279 to install "Windows Performance Toolkit". It's recommended that you edit the EventsForStackTrace.txt file in the gpuview directory to remove SyscallEnter and SyscallExit as doing a stackwalk on every syscall (e.g. QueryPerformanceCounter) can make them show up as more expensive then they would typically be.
GPU vendor tools such as nvidia nsight appear to fail to work with Firefox's multi-process structutre. A work-around is to capture a frame (WebRender's built-in capture) and attach the GPU tool to wrench replaying that capture. Nsight supports exporting a C++ capture which can be helpful for reducing driver test cases.
AMD GPU Analyzer can be useful to get some performance-related information about shaders such as register pressure. It does not require an AMD GPU to run the analysis and works on linux. The Mali offline compiler can (also works on Linux) provides similar info.
In Firefox, "Show Overdraw" mode can be annoying to enable, because about:config is not particularly user friendly when you can't see the text. To add a keyboard shortcut for it, open about:config, open the Web Console to get chrome privileged JavaScript, then paste the following:
!function(){const e="gfx.webrender.debug.show-overdraw",r=Cc["@mozilla.org/preferences-service;1"].getService(Ci.nsIPrefService);window.QueryInterface(Ci.nsIInterfaceRequestor).getInterface(Ci.nsIWebNavigation).QueryInterface(Ci.nsIDocShellTreeItem).rootTreeItem.QueryInterface(Ci.nsIInterfaceRequestor).getInterface(Ci.nsIDOMWindow).addEventListener("keypress",function(n){n.shiftKey&&n.ctrlKey&&"%"===n.key&&r.setBoolPref(e,!r.getBoolPref(e))},!0)}();
This makes Ctrl+Shift+5 toggle "Show Overdraw" mode. Note that you will usually need to have chrome have the focus (for example, by clicking in the URL bar) for this to work.
Some tools fail to work when DirectComposition is enabled on Windows. Disable it in about config if running into issues (pref gfx.webrender.compositor).
GPA system analyzer seems to work well. GTI Throughput numbers may have weird units (https://software.intel.com/en-us/forums/graphics-profiling-debugging-and-analysis/topic/848726).
The system analyzer can be run on a computer (let's call it the runner) while the results are visualized on another computer (viewer). This lets us see the metrics live without affecting the measurements. To do this on windows:
- Install GPA on two computers,
- On the viewer computer, open Graphics Monitor and note the ip address show in the settings menu (top right).
- On the runner open Graphics Monitor and in the same menu, enter the viewer's ip address from the previous step in the Authorized IP Address entry.
- Back to the viewer, open System Analyzer, and towards the top right of the UI, enter the ip address of the runner, and click the "+" button next to it. It should add the runner's metrics at the right of the UI, below the local metrics.
On some optimus laptops, it can happen that GPA doesn't work well if the nvida card is enabled, even if not used. When running into issues it's worth trying to disable the nvidia card in the device manager.
I was able to get frame capturing to work on Wrench on macOS by disabling SIP but the result did replay properly in the frame analysis tool.
Frame capture works in Windows if you disable the GPU process and the launcher process.
Here's a success story from using GPA: https://bugzilla.mozilla.org/show_bug.cgi?id=1663387#c9
Old versions of GPA (2012 R1) support G45 but I was unable to find this or earlier releases.
http://registrationcenter-download.intel.com/akdlm/irc_nas/4211/gpa_14.2_release_225646_windows.exe is the earliest release I could find.
It is possible to get a system wide apitrace using ThinCast. ThinCast is a fork of VirtualBox that includes a D3D11 driver that will forward the driver calls out of the VM and translate them into regular D3D11. This can be done by apitracing VBoxHeadless. There are no frame boundaries so it makes the trace unwieldy.
Parallels also supports translating D3D11 to Metal so could conceivably be used in a similar fashion.
Hyper-V also supports some kind of graphics pass-through using "RemoteFX 3D Video adapter". You can't add this adapter in the GUI anymore but can with Add-VMRemoteFx3dVideoAdapter -VMName [vm_name]. According to gpuview, the rdvgm.exe program ends up receiving these commands and running them. The performance of Hyper-V seems a lot worse than ThinCast and it's not clear how to trace rdvgm.exe
VMWare Player supports D3D11 but it looks like the actual drawing gets done with vmware-vmx.exe. I don't know how get it captured.
Tracy is a performance analysis tool similar to RAD Telemetry; it's not sampling based but uses function scope markup.
The wrapping crate is tracy_rs (doc, github) and the macro is profile_scope! (the patch).
Download Tracy from source and build locally. There are two solutions to build (on Windows, not sure about other platforms): Tracy.sln is the UI viewer/analysis tool, TracyProfiler.sln is the DLL for Firefox.
Before building, in TracyProfiler.cpp add a #define TRACY_DELAYED_INIT (it's already there #ifdef __APPLE__, around line 80).
(Reason: we create our worker threads in bindings.rs before lazy-loading the Tracy DLL in Renderer::new. The DLL uses thread_local globals to create a producer queue per thread for the underlying MPMC queue. Thus earlier threads missed this step; the solution is to use function-scope thread locals, which is what the #define does.
Loading the DLL earlier, in bindings, also crashed the GPU process -- I didn't investigate further since the workaround is OK, at some performance cost).
On unix systems, build with make release:
- The profiler UI executable under
profiler/build/unix, - The shared library under
library/unix.
On Windows the build instructions in the PDF are out of date, run trace\vcpkg\install_vcpkg_dependencies.bat instead. It might install vcpkg if you don't have it yet, if that breaks you can do so manually.
Then build tracy\library\win32\TracyProfiler.sln (Release x64) and add a WR_TRACY_PATH environment variable to point at the resulting TracyProfiler.dll.
If you build and run tracy\profiler\build\win32\Tracy.sln and press 'Connect', you can test if things work on the Rust side when that 'Waiting for connection...' dialog changes into a live view. Showing a YAML file with Wrench seems to work out of the box (with the above env-var set) so that's an easier-than-Firefox test case.
For Firefox, profiling must be enabled:
- add
"profiler"to the list offeatures=under[dependencies.webrender]ingfx/webrender_bindings/Cargo.toml; - run
./mach vendor rust --ignore-modifiedto fix any compile errors due to missing crates;
Then, export WR_TRACY_PATH to point the DLL/so built earlier.
To use the profiler, start Firefox, start tracy's executable and connect to the default address (127.0.0.1).
The steps above also work with wrench.
- Use
profile_scopeto get a begin/end marker and a duration.- The "statistics" are very useful to see the mean/median/deviation of wobbly numbers...
- ... and Compare Trace can show you two runs overlaid to check if an optimization is panning out;
- Use
profile_plotto trace a number, eg. number of glyphs rasterized.- This unfortunately has no statistics, and plots as a line graph, not a bar chart.
- Still very useful to see when & how many things happen -- cache evictions, GPU memory allocations, etc.
- In both cases the text must be static, don't
formatdynamic strings.
On macOS and maybe Windows, it's possible to get the AMD driver to dump information about the compiled shaders, including the disassembly, by setting the AMD_SC_DUMP_ALL=1 environment variable.