ref debug
Check the activity log. The Melody Activity Log is perhaps one of the most under-rated and under-utilized features of Melody. Virtually every action of interest inside the application is recorded there, providing a pretty reliable audit trail for the application, your content and your users. It can also provide a useful source of debugging information.
Melody has a built-in developer mode that modifies the behavior of the application slightly to make it easier for developers to build, test and debug plugins they are building on top of Melody. This mode is activated when the DebugMode configuration directive has been added to the installation's config.cgi file.
When in "DebugMode" Melody can:
- Monitor the API plugins use and report any issues, discrepancies or ways in which the plugin may not be fully compatible with MT4.
- Use the non-compressed javascript files allowing javascript debuggers to more easily report specific line numbers and files in which problems may be occurring
- Use non-compressed CSS files allowing debuggers to report more precisely about what stylesheet problems may exist
- The
devel.jsjavascript file will be included on each page of the application. This javascript file outputs log information to the browser console so that plugins like Firefox's FireBug can capture and report to developers debugging information about javascript code running on the page. IE and Safari users will have this information displayed to them through javascript pop-ups. - And warnings emanating from plugin code or perl code will be displayed at the bottom of the page. This provides a nice linting framework for reporting possible issues with the plugin.
DebugMode requires the perl module Time::HiRes in order to function. Check with your webhost to see if it's installed or install it yourself prior to enabling DebugMode.
To turn on Debug Mode within Melody, edit your config.cgi file and add the following line:
DebugMode 1
The DebugMode is a bit-wise setting and offers the following options:
- 1 - Display debug messages
- 2 - Display a stack trace for messages captured
- 4 - Lists queries issued by Data::ObjectDriver
- 8 - Reports on MT templates that take more than 1/4 second to build*
- 128 - Outputs app-level request/response information to STDERR.
These can be combined, so if you want to display queries and debug messages, use a DebugMode of 5 for instance.
By setting the DebugMode to a value of 8, you can get some performance information about your template tags. These messages get sent to your web servers error log or STDERR. He is some sample output:
Builder: Tag [Assets] - 12.007559 seconds
Builder: Tag [Tags] - 0.877185 seconds
Builder: Tag [If] - 0.877515 seconds
Builder: Tag [Include] - 1.063821 seconds
Builder: Tag [Else] - 1.064076 seconds
Builder: Tag [If] - 1.064391 seconds
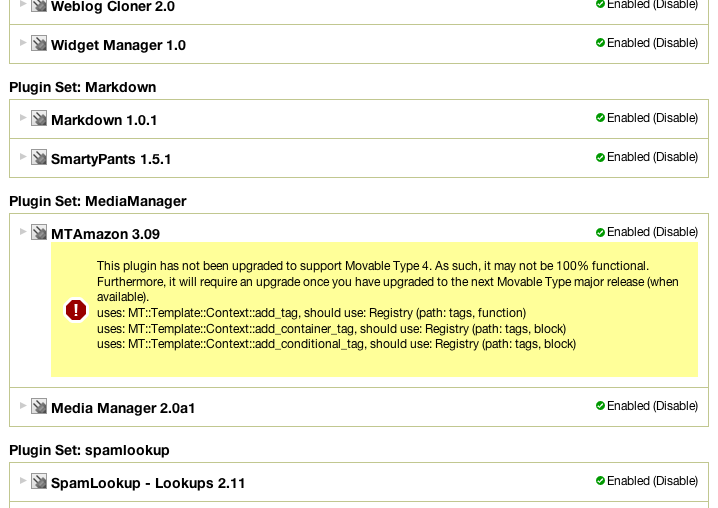
When Debug Mode is enabled, Melody will report for each enabled plugin the use of any deprecated API. This is a very simple way for example to ensure that your plugins do not make calls to methods or subroutines that might in the future be removed. The screenshot below shows what type of information is displayed when DebugMode is set to "1".
Questions, comments, can't find something? Let us know at our community outpost on Get Satisfaction.
- Author: Six Apart Ltd., Byrne Reese
- Edited by: Violet Bliss Dietz