Skip to content

Quick experimentation of Bollinger Bands trading strategy over Bitstamp BTCUSD using Pandas and Matplotlib 🐍

Notifications You must be signed in to change notification settings

martinzugnoni/bollinger-bands-trading-analysis

Folders and files

NameName
Last commit message
Last commit date

Latest commit

Β 

History

9 Commits
Β 
Β 
Β 
Β 

Repository files navigation

Bollinger Bands trading analysis πŸ“ˆ

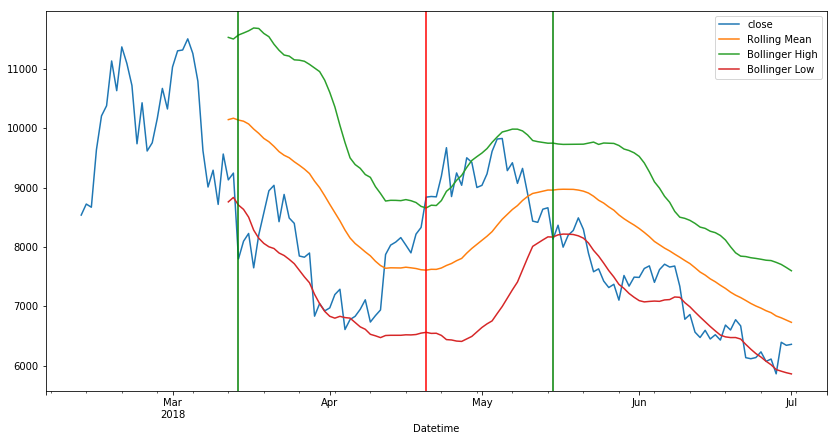
This is a quick experimentation of the Bollinger Bands trading strategy over the Bitstamp BTCUSD price using Python. 🐍

important: Information shared in this repo must not be considered as financial advice. Distribute only for educational purposes. Use it under your own risk.

The data set was downloaded from http://api.bitcoincharts.com/v1/csv/, corresponding to the historical BTCUSD price in Bitstamp exchange. Despite having data from 2014, the analysis is mainly concentrated in prices during 2018.

I used Pandas to parse and analyze prices, and Matplotlib to plot strategies returns.

image

About

Quick experimentation of Bollinger Bands trading strategy over Bitstamp BTCUSD using Pandas and Matplotlib 🐍

Resources

Stars

Watchers

Forks

Releases

No releases published

Packages

No packages published