Before this project, our client had the following problems:
- No scalability, having to manually collect CSV data from multiple branches.
- No insight on their data to provide to business users.
- No available analytics for owners to grow and develop their business.
Thankfully our client approached us with this problem for which we developed a solution over 5 weeks.
The cafe ETL pipeline will aggregate all the transaction data generated by each individual branch, transform the data, and then upload it to a data warehouse. This will allow the user to improve their analytic prowess and take more beneficial data-informed decisions based on past trends.
- Contributors
- Data visualisation
- Data model
- AWS Resources breakdown
- CI/CD
- Extraction
- Transformation
- Load
- Development process
- Would you do anything differently?
- What did we enjoy?
 Carlton Nunes Desouza |
 Sharjeel A Sajid |
 Nayan Gurung |
 Tiffany |
 Abdullah |
- Created AWS resources with the CloudFormation template.
- Drove the creation of our AWS Lambda function handlers.
- Wrote helper scripts in a Makefile for the team's development process.
- Added a Github action workflow for deploying our changes to production.
- Created GitHub action workflow for linting and testing.
- Contributed to code for extraction.
- Contributed to testing.
- Wrote code to transform data
- Contributed to testing
- Created data models
- Wrote SQL script to create tables
- Contributed in ETL process and drew up diagram of pipeline
- Wrote queries in Grafana to visualise data
- Contributed to the creation of the ETL
- Created majority of presentation slides.
- Created Grafana queries for data visualisation
- Python 3.9
- Make (Optional)
- Create your Python 3.9 Virtual Environment
- Run
make dev
If you’d like to contribute to this project please use our pull-request template.
Below is a visual look at the flow of our pipeline and the process we went through to transforming your data.Every day at 8pm your data is uploaded as a CSV file where it is then stored inside of a s3 bucket this then triggers a lambda that further transforms the data and uploads them to a s3 bucket then send a message to the queue which operates on a F.I.F.O first in first out process, that defines the order for our lambda which only executes one job at a time. Load lambda gets alerted by the arrival of the queue message and begins downloading files the message told them about from the target S3 bucket (products_<original_file_name>.csv,transactions_<original_file_name>.csv), then completes the loading process. data then goes to the Redshift staging schema to be transformed then gets temporarily stored in an s3 bucket and later moved to the public schema.

We use an AWS EC2 instance to connect to Grafana. Grafana allows us to query data and visualise this data through the use of charts and graphs. This is especially useful to your business as this allows you to write SQL queries to analyse the performance of products and branches

The above image shows you a query of two types of visualised data one showcasing the best performing products across all branches, with this type of information at your fingertips The possibility for maximising profits will greatly increase. By understanding what products are your customers favourite vs what products do not perform so well, can save you money and allow you to refine your product list of items your customers really engage with. The second query analyses how different products performed at different branches. This information again is extremely valuable to your business as products could be better suited in certain locations.
Grafana also allows us to monitor Cloud watch logs this means that we can keep track of the pipeline in each stage of its process tracking errors and invocations visually.below is an image of a query tracking all invocation and any errors that occurred in that process.

Cloud watch logs are important because it allows us to monitor, store and access log files.We are able to fix issues quickly , track changes made and improve the performance of our system. Something we haven't implemented but is possible and also beneficial is that cloud watch logs can also be used to trigger alarms and automated actions which can improve the security and reliability; it can also save money if alarms are set on making sure we do not go over certain limits within AWS.
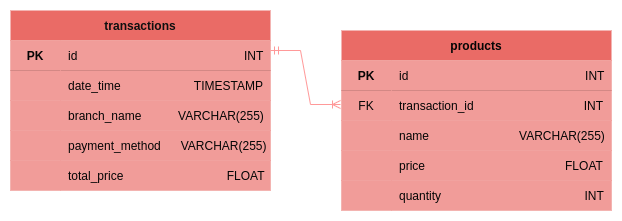
We have used the following data model in our project. This ensures that there are no multivalued attributes, however one of the main problems with this data model is that there are partial dependencies and transitive partial dependencies.
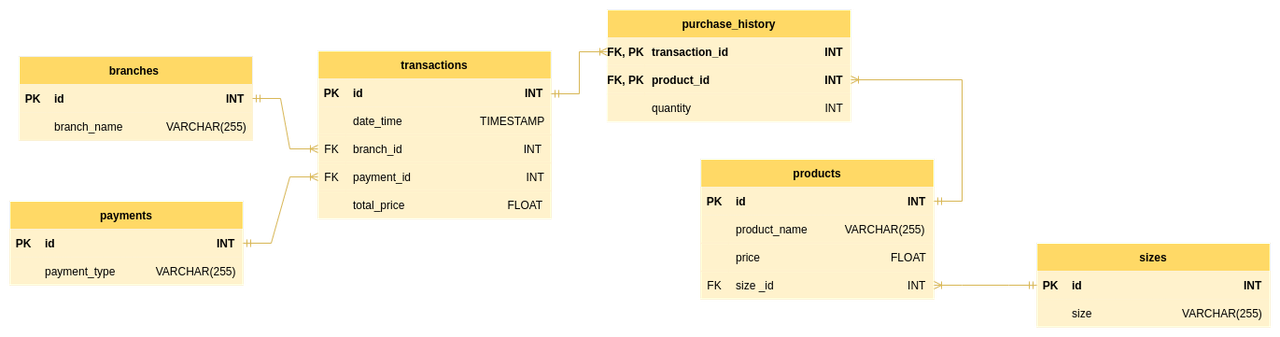
To overcome these issues, we would ideally want to have our data in third normal form. So we redesigned our data model but have not implemented it in our project due to time constraints. In this data model, we have added four new tables: purchase_history, branches, payments, and sizes. We created branches, payments, and sizes tables because non key attributes such as payment, size, and branch were not fully dependent on their respective primary key.We had to create the purchase_history to account for the many-to-many relationship between transactions and products and to remove data duplication.
Amazon Web Services is a cloud platform that allows us to leverage resources that abstract away many of the complexities of managing on-premise servers. Here we use just a handful of powerful resources, most notably AWS Lambda, S3 (Simple Storage Solution) and Amazon Redshift as our data warehouse.
These resources however still require configuring correctly in order to help keep costs low and data secure. To manage these resources we use yet another tool that AWS provides. CloudFormation gives us the ability to ‘template’ our stack of resources to create them, destroy them and even update them with ease. This is especially powerful in terms of CI/CD which we will discuss very soon.
Resources:
  LambdaFunctionLoad:
    Type: AWS::Lambda::Function
    Properties:
      FunctionName: group3-load-lambda-needed
      Runtime: python3.9
      Handler: src/lambdas/load_handler.handler
      ReservedConcurrentExecutions: 1
      Timeout: 10
      Role: arn:aws:iam::948243690849:role/lambda-execution-role
      Layers:
        - arn:aws:lambda:eu-west-1:336392948345:layer:AWSSDKPandas-Python39:2
        - !Ref LambdaRequirementsLayer
      Code:
        S3Bucket: !Ref DeploymentBucket
        S3Key: !Ref DeploymentCode
      VpcConfig:
        SecurityGroupIds:
          - sg-09ddd305daee3cb89
        SubnetIds:
          - subnet-0ec1bb10a4f1c8bc2
    DependsOn:
      - LambdaRequirementsLayer
This is an instance of AWS Lambda being configured in a CloudFormation template. You can see there are a lot of configuration options available to us, almost everything available from the AWS console can be configured within these templates. The power of CloudFormation comes in the ability to recreate these resources for different environments, such as a separate testing environment which lends it perfectly for use within a CI/CD pipeline.
Parameters:
  DeploymentBucket:
    Type: String
    Default: group3-stack-deployment-needed
  DeploymentRequirements:
    Type: String
    Default: code/requirements.zip
  DeploymentCode:
    Type: String
    Default: code/deploy_code_v1.zip
This stack of resources can be parameterized allowing us to use the same template, but slightly altering it to create an isolated testing environment that doesn’t interfere with production.
We utilised GitHub Actions for our project for CI/CD integration and automation. In order to do so we created a YAML file to check two essential components, code linting and testing.
Continuous integration is quite essential to ensure that the code stays up to date and clean. To do so we implemented the following workflow:
on:
  pull_request:
    branches: ["main"]
    paths:
      - "src/**/*.py"
      - "tests/**/*.py"

jobs:
  linting:
    runs-on: ubuntu-latest
    steps:
      - name: Checkout project source code
        uses: actions/checkout@v3
      - name: Lint with black
        uses: psf/black@main
        with:
          src: "src"
      - name: Lint with isort
        uses: isort/isort-action@master
        with:
          configuration: "--check-only --profile black"
      - name: Lint with flake8
        uses: py-actions/flake8@v2
The code linting was conducted with the python packages iSort and Black. Following the mantra of simpler is better, iSort was used to ensure the various imports into the library were ordered logically and separated into the appropriate types. Likewise, we used Black to ensure consistent formatting of the code. This was essential as we had various people working on the code and to ensure its cleanliness we had to use the black package.'
We had originally chosen to go with the ‘blue’ package for the code formatting which we ended up changing. During the implementation of GitHub Actions, we came to realise that it wasn’t easily supported and that we would have to spend more time creating the right environment for it to run. Therefore, in the interest of time and efficiency, we instead chose Black.
Likewise, we ensured continuous deployment by creating another YAML file that ensured that any changes in the code were automatically deployed to the cloud. This allowed us to implement some automation into our workflow and ensure that the code is up to date with any changes we might have made. We also included a fail-safe that ensured that one would have to manually trigger the deployment by confirming it post-push.
name: AWS Deploy Production

on:
  workflow_dispatch:

permissions:
  id-token: write
  contents: read

jobs:
  deploy:
    name: Deploy AWS Cloudformation
    runs-on: ubuntu-latest

    steps:
      - name: Configure AWS credentials
        uses: aws-actions/configure-aws-credentials@v1-node16
        with:
          role-to-assume: arn:aws:iam::${{ secrets.AWS_ACCOUNT_ID }}:role/github-deploy-role
          aws-region: eu-west-1
          role-duration-seconds: 1200

      - uses: actions/checkout@v3
      - name: Setting up Python
        uses: actions/setup-python@v4
        with:
          python-version: "3.9"

      - name: Deploy
run: make aws-deploy-prodOnce the data has been loaded into the s3 bucket with a CSV format, an event triggers the transformation lambda starting with the Extraction process. This is to prepare for the Transformation process of the ETL Pipeline.
import pandas as pdThis line is used to import pandas under the name “pd”. Pandas is a python package that we have imported in order to utilise its tools and functions such as the read_csv function.
def extract_data(filename):
    file = pd.read_csv(filename, header=None)
    df = pd.DataFrame(file)
    df.index = range(1, len(df) + 1)
    return df
This code contains a function called extract_data. This utilises the read_csv function imported from the Pandas Python package in order to transfer all of the data from the CSV to be stored in a dataframe under the “df” variable. Primary keys cannot start from 0, which is why the read_csv index starts from line 1 and can end on the final line of the CSV.
COLUMN_NAMES = [
    "date_time",
    "branch_name",
    "customer_name",
    "products",
    "total_price",
    "payment_method",
    "card_number",
]
We create the column names in advance to be used during the Transformation process. The column names are based on the data that will be imported from the CSV files in the s3 bucket.
def create_columns(data, column_names):
    data.columns = column_names
    return data
We complete the extraction process by programming the function create_columns. This function is created to be used further down the ETL process where it creates columns in a database based on whichever column headers have been provided.
Due to the sensitive nature of the data entrusted to us, we had to ensure that it was being appropriately handled. Part of this responsibility was to ensure that any personally identifiable information was removed before the data was then transformed for its subsequent needs. In order to do this, we devised functions written in python code that would clear the data of such:
SENSITIVE_COLUMNS = ["customer_name", "card_number"]

def remove_user_info(data_frame, sensitive_columns):
    return data_frame.drop(columns=sensitive_columns)
This function ensures that the sensitive data doesn’t get shared with people that aren’t authorised to access it. As this function plays a vital role in the whole process, sufficient testing was of the essence in ensuring its proper functioning. We then designed the following test to ensure that it worked with some mock data:
@pytest.fixture
def sensitive_data():
   data = {
       'id': [1, 2],
       'customer_name': ['Nayan', 'Sharjeel'],
       'branch_name': ['Chesterfield', 'London'],
       'card_number': [5494173772652516, 1166596230622281],
   }
   return pandas.DataFrame(data)


def test_dropped_columns(sensitive_data):

   result = remove_user_info(sensitive_data, SENSITIVE_COLUMNS)

   for column in SENSITIVE_COLUMNS:
       assert column not in result.columns
This was the very first step in the process of data transformation. Following this, the data needed to be normalised and cleaned for it to be of use further downstream. For this purpose, we devised the following code.
After we extracted the data from the original dataset, we divided it into two new DataFrames: one for products and one for transactions. For the ‘transactions’ DataFrame, we only had to format its date column with the correct format, YYYY-MM-DD HH:MM:SS.

For the products DataFrame, we needed to ensure each row only contained information about one product and the price of the product had to be in a separate column.

To tackle these issues, we created a function that loops over each row of the DataFrame and cleans each row so that each row only contains single-valued attributes.
We first had to split the string containing all the products into a list of products.
def get_products(row):
    products_in_row = row["products"].split(",")
    for product_index, product in enumerate(products_in_row):
        products_in_row[product_index] = product.strip()
    return products_in_row
Then, we converted each product in the list to a dictionary. This was done to separate the details of each product.
def to_dict(row_index, product):
    product = {
        "product_name": get_product_name(product),
        "quantity": 0,
        "transaction_id": row_index,
        "price": get_price(product),
    }
    return product
We updated the quantity of each product.
def update_quantity(products):
    unique_products = get_unique_products(products)
    for unique_product in unique_products:
        for product in products:
            if unique_product["product_name"] == product["product_name"]:
                unique_product["quantity"] += 1

    return unique_products
FInally, we created a new dataframe using this list of products.
    . . .
    df = pd.DataFrame(cleaned_rows)
To ensure that the index began from 1 rather than 0, as it wouldn’t satisfy the requirements for the data to be uploaded to Redshift, a new function was devised. The function ensured that the index began from 0 and the data thereby be of use.
df.index = range(1, len(df) + 1)To ensure our code works as we intended, we wrote unit tests for each of these functions.
The second AWS Lambda function that we use is responsible for loading our newly transformed data into our Amazon Redshift data warehouse. At a high level, this process is as simple as utilising a third-party package Psycopg2 to connect to our data warehouse and send SQL queries, but there’s some more going on behind the scenes.
Firstly in order to use external libraries within our Lambda function we need to package and upload this as a Lambda Layer. This is done by installing our requirements within a Docker container built off of the same architecture that our AWS Lambda instance uses in order to avoid any related complications, and then uploading that to an S3 bucket.
The next important step is reading the message that triggers our Lambda from Amazon SQS (Simple Queue Service) which contains the bucket name and object keys of the transformed CSV files waiting to be loaded into Redshift.
with connector.cursor() as curs:
    print("COPYING TO PRODUCTS")
    curs.execute(
        "COPY staging.products FROM %s IAM_ROLE %s CSV;",
        (
            f"s3://{bucket}/{files[1]}",
            ROLE,
        ),
    )
We then use the information provided to us by querying our data warehouse and running the COPY command in SQL to copy the contents of this CSV file to a staging schema. This schema is a direct copy of our production tables that we use to handle some extra transformation.
with connector.cursor() as curs:
    print("UPDATE PRODUCTS")
    curs.execute(
        """
        UPDATE staging.products
        SET id = id + (
            SELECT NVL(MAX(id), 0)
            FROM public.products
        ),
        transaction_id = transaction_id + (
            SELECT NVL(MAX(transaction_id), 0)
            FROM public.products
        );
        """
    )
Within this staging table, we then query our database again with an UPDATE command, this allows us to dynamically update the id column as well as any relevant foreign keys such as products.transaction_id based on the largest current id value in the public schema.
with connector.cursor() as curs:
    print("UNLOADING PRODUCTS")
    curs.execute(
        """
        UNLOAD ( 'SELECT * FROM staging.products' )
        TO %s
        IAM_ROLE %s
        REGION 'eu-west-1'
        PARALLEL OFF
        ALLOWOVERWRITE
        CSV;
        """,
        (
            f"s3://{STAGING}/staging_products.csv",
            ROLE,
        ),
    )

# ...

with connector.cursor() as curs:
    print("COPYING TO PRODUCTS")
    curs.execute(
        "COPY public.products FROM %s IAM_ROLE %s CSV;",
        (
            f"s3://{STAGING}/staging_products.csv000",
            ROLE,
        ),
    )
This next step is an important decision that we made regarding moving large amounts of data from one table to another within Amazon Redshift. While we could move our fully transformed data to the public schema with a simple ‘INSERT’ command such as INSERT INTO public.<table> ( SELECT * FROM staging.<table> );, AWS documentation tells us that the far more efficient approach is to use ‘COPY’ again by first uploading to another S3 bucket with ‘UNLOAD’. We found following this recommendation meant that our Lambda was faster through our testing of both the ‘INSERT’ and ‘COPY’ methods.
try:
    # ...

    connector.commit()
except Exception as e:
    print(f"ERROR: {e}")
finally:
    print("CONNECTION CLOSED")
    connector.close()
Finally, we wrap up the function by using ‘TRUNCATE’ to empty our staging tables ready for the next batch of data to process, committing our changes provided there were no errors, and safely closing our connection. If any error occurs during the runtime of our function these changes are not committed, thus making sure this process is atomic. Either 100% of this lambda works, or none of it does!
As we were receiving the requirements for our project we aimed to complete all the tickets as soon as they arrived. This had the benefit that we were able to present the proof of concept and the minimally viable product by the end of the first week. The team created a Docker compose file to store a MySQL database locally. We also used an ‘Adminer’ image to query and visualise the uploaded data. This allowed every member of the team to spin up the environment on their local machines.
Through the dedication of everyone involved we ensured that the tasks were all completed. There were, however, some complications, particularly in the initial weeks of the process. We were left without a product owner - essential in the conventional functioning of the scrum methodology. This meant that we couldn’t confirm all the requirements of the client. This had the knock-on effect that we took on additional technical debt in the initial stages that we built on.
During the first week of the sprint, all the tickets were divided among the members of the team. The scrum methodology of continuous communication among the team members meant that we were able to complete tasks, write the tickets off and review the work completed with others to ensure consistency in the completed work. Likewise, setting a time limit for completing the tasks before they were considered to be blocked was another step that ensured efficiency among the team.
Initial directory layout
.
├── Makefile
├── README.md
├── app.py
├── docker-compose.yml
├── pyproject.toml
├── requirements.txt
├── requirements_dev.txt
├── scripts
│   ├── create_database.sh
│   └── sql
│       └── create_tables.sql
├── src
│   ├── extraction
│   │   ├── __init__.py
│   │   └── csv_handler.py
│   ├── load
│   │   ├── __init__.py
│   │   ├── loader.py
│   │   └── utils.py
│   └── normalise
│       ├── __init__.py
│       └── clean.py
└── tests
    ├── __init__.py
    ├── mock_data
    │   ├── mock.csv
    │   └── mock_empty.csv
    ├── test_clean.py
    └── test_csv_handler.py
In the second week, the team focused on completing AWS spikes, which required learning different AWS services. Initially, the learning tasks were completed individually, but it was soon realised that it would be more beneficial for the team to complete these sessions together. As a result, the remainder of the week was spent collaborating and practising with the AWS services, ensuring that everyone improved their fluency and understanding. The CloudFormation file was set and executed to create and deploy the lambdas and s3 buckets.
The team were then given more instructions on the client's needs and expectations during the third week. Fortunately, we were able to collaborate with the client henceforth and ensured that all the implemented changes were to the client's needs and wishes. During this time the team was able to connect the instances to Redshift to store the cleaned data through the use of a load lambda.
During the fourth week, the team moved on to creating a CI/CD pipeline using GitHub Actions. The team created a YAML file to automate the linting and testing of the code. Additionally, we focussed on the implementation of Grafana to both log, the running of the various services and query the data uploaded to AWS Redshift.
Final directory layout
.
├── Makefile
├── README.md
├── deployment
│   └── templates
│       └── template-v1-create.yaml
├── pyproject.toml
├── requirements.txt
├── requirements_dev.txt
├── scripts
│   └── deploy_stack.sh
├── src
│   ├── extraction
│   │   ├── __init__.py
│   │   └── csv_handler.py
│   ├── lambdas
│   │   ├── load_handler.py
│   │   └── normalise_handler.py
│   └── normalise
│       ├── __init__.py
│       └── clean.py
└── tests
    ├── __init__.py
    ├── mock_data
    │   ├── mock.csv
    │   └── mock_empty.csv
    ├── test_clean.py
    └── test_csv_handler.py
If our group were to start over, we would certainly be able to improve our project tenfold. Our first priority would be to normalise our data to the 3rd normal form. Due to time constraints and a general lack of communication with our client during the first few weeks, it was more beneficial for us to focus our efforts towards other equally important aspects of the project. This meant that our temporary database design was used throughout the project and was not updated to the client’s desired quality within our time-frame.
Moreover, our python programming’s quality had room for improvement. If we had started the project with test driven development (TDD), we could improve the logic of our code as we built up functionality during the project’s development. Although we had created unit tests for our program, we could have also created integration testing and focused on finishing end-to-end testing to increase our program’s quality and consistency.
Furthermore, we weren’t as consistent with our documentation as we might have preferred. During the second and third sprints of our project, our priority was to learn about and comprehend the nuances of the tools that the client had expected us to utilise (Redshift, Grafana, Cloudwatch, Lambda, etc). This meant that we delayed progress on our documentation such as our ReadMe during those weeks. This was done to ensure that we had a viable product for the client to sign off on. If we had to start over, we certainly would focus on consistently writing ReadMe files and other documentation for each sprint to demonstrate our project’s development and functionality.
Carlton: I had a really heavy focus on Cloud Computing which I enjoyed a lot more than I thought I would, AWS’ documentation was amazing to work with. I especially liked setting up shell scripts to help our workflow just as setting up a development environment with a single command. This came in very handy when setting up our Github Action for deploying our changes.
Sharjeel: I particularly enjoyed learning about the various different services that AWS provides and getting a fully functional ETL pipeline. I also enjoyed the testing aspect of the whole project. I got to appreciate the various steps the data takes before it can be manipulated meaningfully.
Nayan: I enjoyed working on data normalisation and unit tests.
Tiffany: I enjoyed working and learning as a team; understanding the AWS console and the different resources available to build a pipeline. I also enjoyed querying the data in grafana and seeing this visually represented through graphs and charts, Understanding how business can benefit from data being queried and analysed to increase profits.
Abdullah: I enjoyed learning about the AWS resources and the ETL Pipeline with a group of like-minded individuals. Learning and working with a team to create a workable product in a professional environment.