Nicolas Cardenas
February 20 2025

In this tutorial, we will first describe what RStudio is and why we are using it for data analysis. Learning R can take time, and it's normal if some concepts feel unclear at first. Even experienced users frequently look things up! The goal of this tutorial is to reinforce key concepts through repeated practical demonstrations, helping you build confidence and fluency. By the end, you'll be able to manipulate and visualize data effectively, which is crucial in veterinary research and practice.
In this section, we will cover more advanced methods for handling and manipulating data, learn to create plots using ggplot2, and discuss the benefits of writing reusable R scripts. These skills are essential for veterinarians who want to analyze and interpret large datasets, such as those related to animal health or behavior.
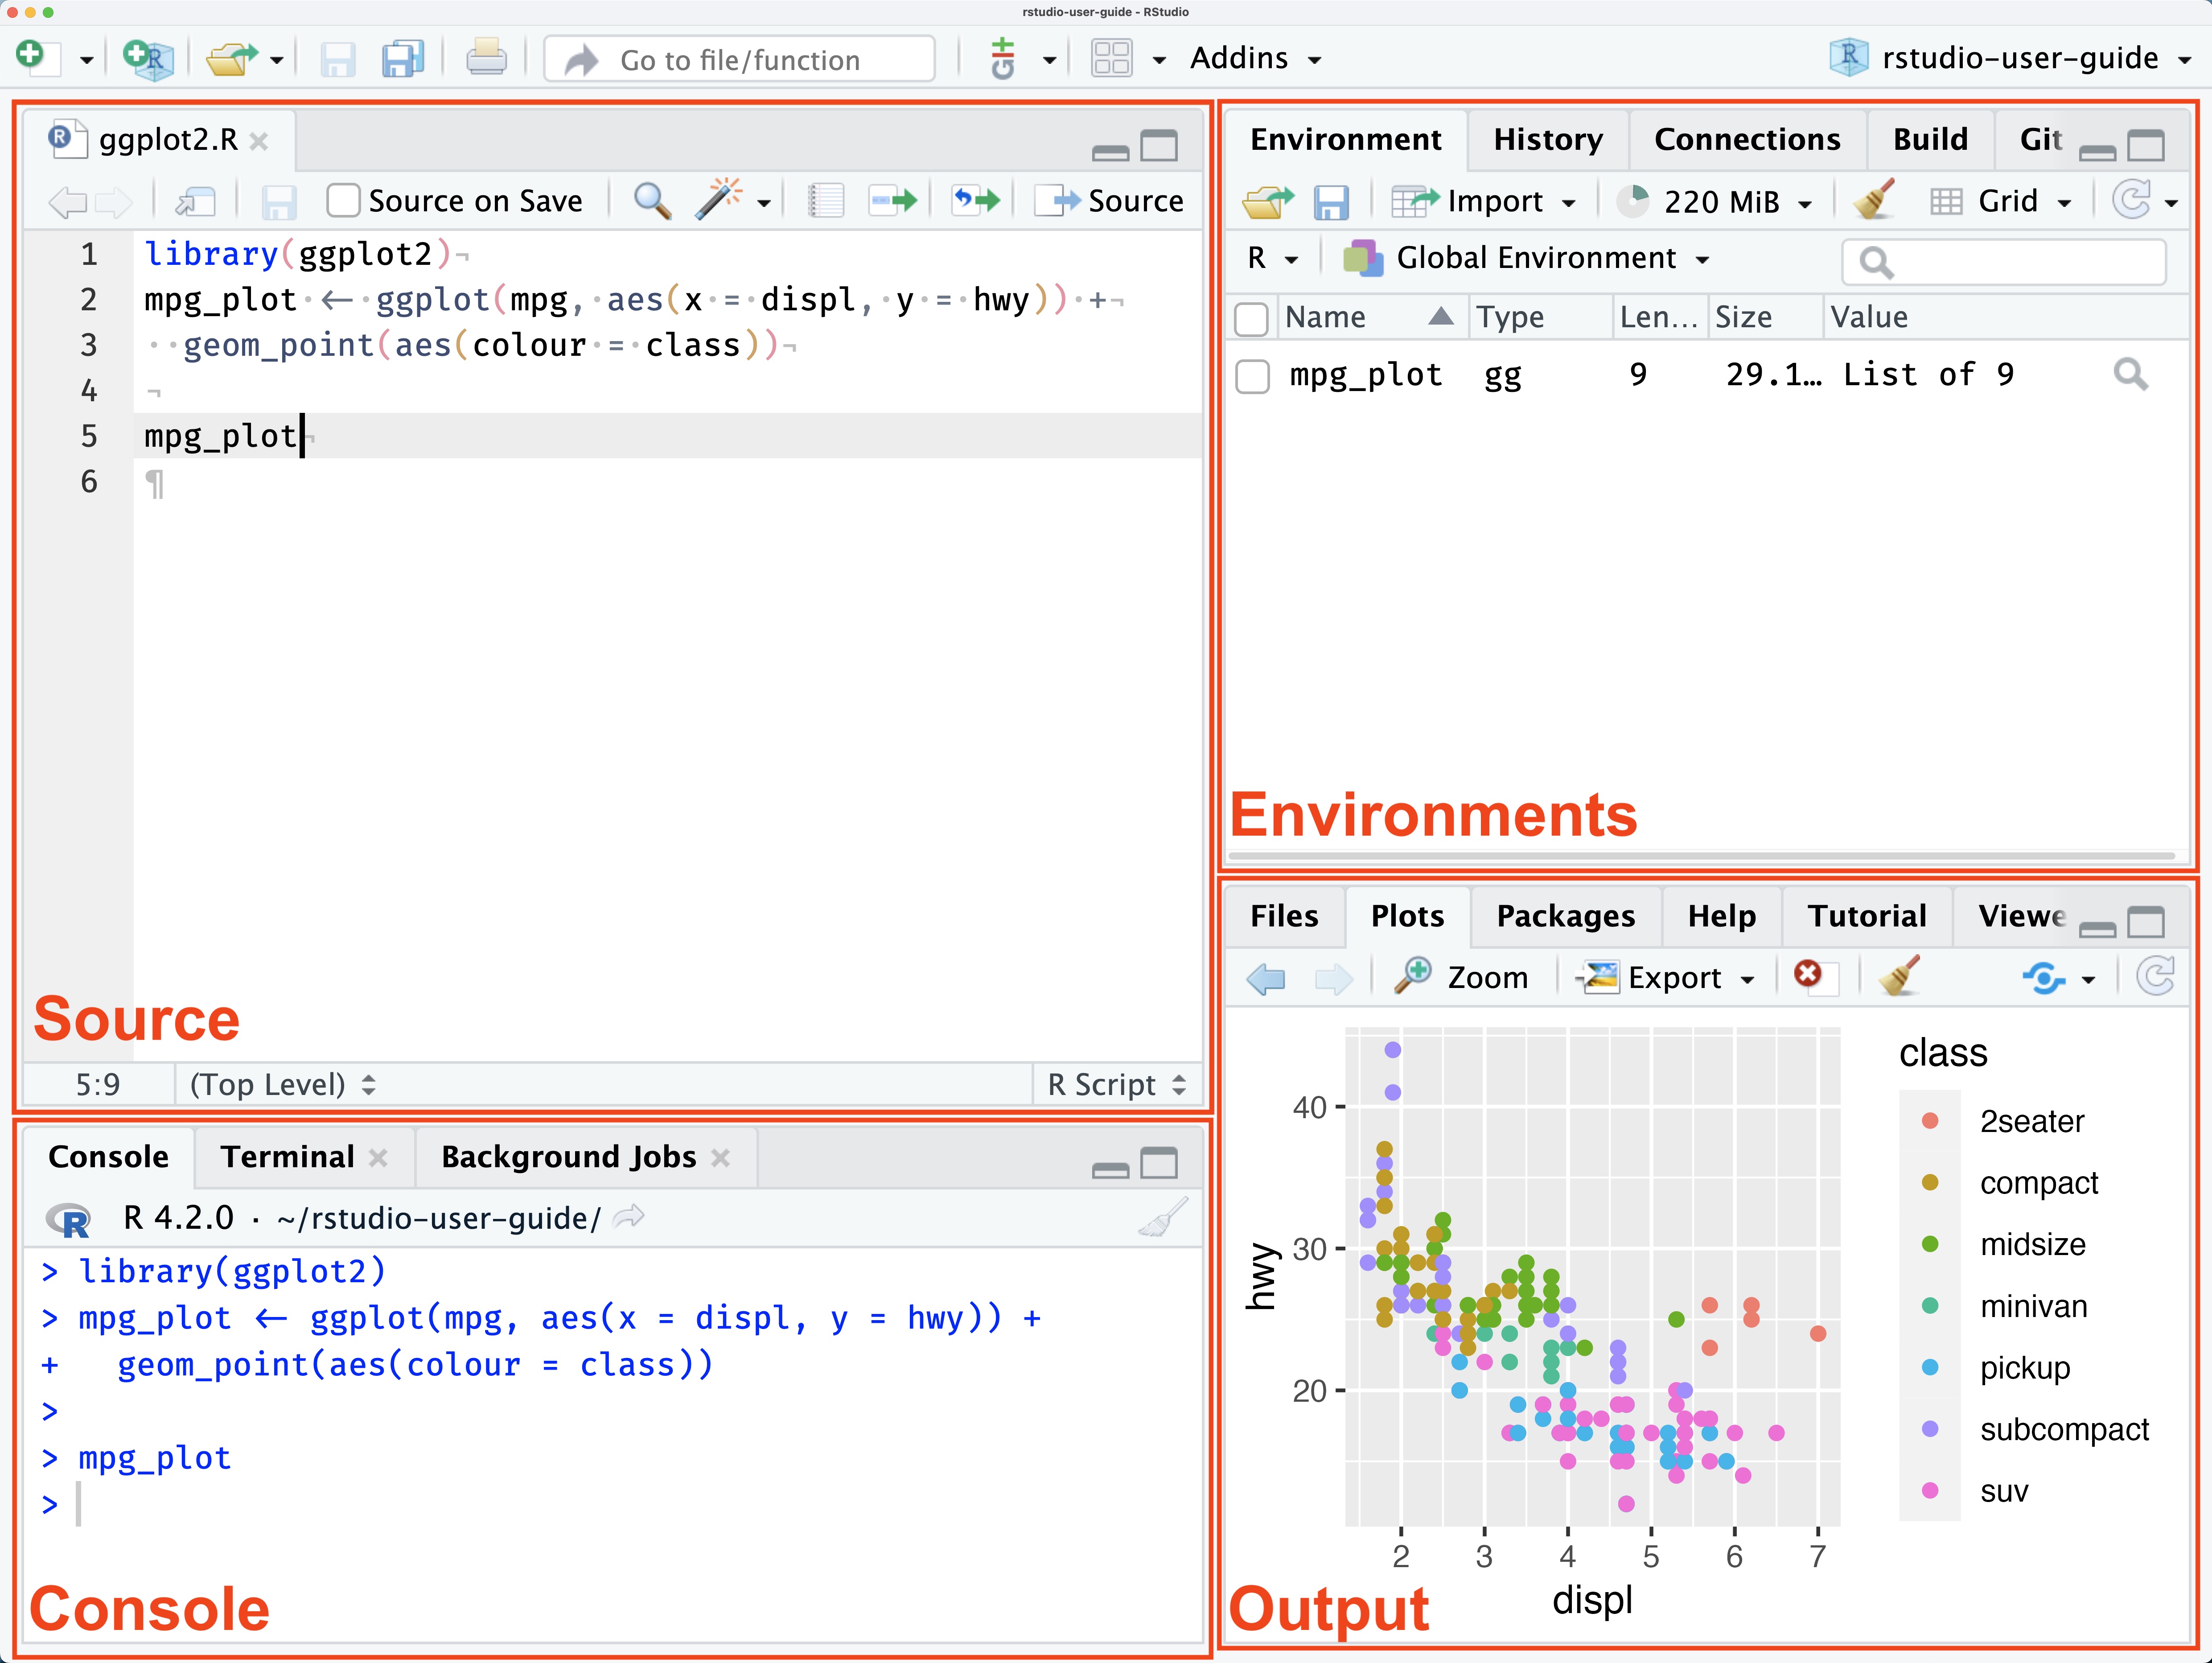
- Source: The script editor where you write and edit R code. It allows for multiple scripts and markdown files to be opened simultaneously.
- Environment: Displays objects, such as data frames and variables, that are currently loaded in your session. It helps track your workspace.
- Console: The interactive area where R commands are executed. You can run code directly here or send it from the Source pane.
- Output: This includes the Plots, Viewer, and Help tabs, where visualizations, web content, and documentation are displayed.
install.packages("tidyverse")  # Install the package (only once)
install.packages("pokemon")    # Install the package (only once)
library(tidyverse)  # Load the package
library(pokemon)
We will use a dataset of Pokemon information. The dataset contains 949 rows and 22 columns, including information such as the Pokemon’s name, ID, height, weight, stats, type, and more. A dictionary of variables can be accessed here.
# Load pokemon data
pokemondata = pokemon
# data overview
glimpse(pokemondata)
View(pokemondata)# Selecting variables (create a new object with the data)
poke_select = pokemondata %>%
select(pokemon, type_1, hp)
# Eliminate variables (keep the same data object)
pokemondata = pokemondata %>%
select(-id, -url_image, -url_icon)pokemondata_filtered = pokemondata %>%
filter(base_experience > 200 )filter: We filter the dataset to include only rows wherebase_experienceis greater than 200
vet_data %>%
mutate(weight_kg = weight_lbs * 0.453592)# Use dplyr to manipulate the data
modified_data <- pokemon_data %>%
# Replace "fire" with "flame" and create type_1 new column
mutate(type_1_new = replace(type_1, type_1 == "fire", "flame"))mutate: We usemutateto modify thetype_1column. Thereplacefunction is used to change all instances of"fire"to"flame".
We want to group the Pokemon by their type_1 and calculate:
-
The average
base_experiencefor each type. -
The maximum
heightfor each type. -
The total
weightfor each type.
# Group by type_1 and summarize
summary_data <- pokemon %>%
  group_by(type_1) %>%
  summarize(
    avg_base_experience = mean(base_experience, na.rm = TRUE), # Average base experience
    max_height = max(height, na.rm = TRUE),                   # Maximum height
    total_weight = sum(weight, na.rm = TRUE)                  # Total weight
)group_by(type_1): Groups the data by the type_1 column.
summarize: Calculates summary statistics for each group:
-
avg_base_experience: The averagebase_experiencefor each type. -
max_height: The maximumheightfor each type. -
total_weight: The totalweightfor each type.
na.rm = TRUE: Ensures that missing values are ignored in calculations.
sorted_by_experience <- pokemon %>%
arrange(desc(base_experience))# Create a scatter plot: Weight vs. Height, colored by Type
ggplot(pokemon, aes(x = weight, y = height, color = type_1)) +
geom_point(size = 3, alpha = 0.7) + # Scatter plot points
labs(
title = "Pokemon Height vs. Weight",
x = "Weight (kg)",
y = "Height (m)",
color = "Primary Type"
)-
aes(x = weight, y = height, color = type_1): Maps weight and height, coloring points by Pokemon type. -
geom_point(size = 3, alpha = 0.7): Controls point size and transparency. -
labs(...): Adds titles and axis labels.
# Create a bar plot: Average Base Experience by Type
ggplot(summary_pokemon,
       aes(x = reorder(type_1, avg_base_experience),
           y = avg_base_experience, fill = type_1)) +
  geom_bar(stat = "identity", show.legend = FALSE) + # Use identity to map values
  coord_flip() + # Flip for better readability
  labs(
    title = "Average Base Experience by Pokemon Type",
    x = "Pokemon Type",
    y = "Average Base Experience"
) -
reorder(type_1, avg_base_experience): Sorts bars by experience. -
geom_bar(stat = "identity"): Uses actual values instead of count. -
coord_flip(): Makes it horizontal for better readability.
# Create a histogram of base experience
ggplot(pokemon,
       aes(x = base_experience)) +
  geom_histogram(binwidth = 20,
                 fill = "steelblue",
                 color = "black",
                 alpha = 0.7) +
  labs(
    title = "Distribution of Pokemon Base Experience",
    x = "Base Experience",
    y = "Count of Pokemon"
  )
aes(x = base_experience): Maps base experience values to the x-axis.
geom_histogram(binwidth = 20, fill = "steelblue", color = "black", alpha = 0.7):
-
Uses bins of width 20.
-
Colors bars blue with black edges.
-
alpha = 0.7makes bars slightly transparent.
# Create a boxplot of base experience by Pokemon type
ggplot(pokemon,
       aes(x = reorder(type_1, base_experience, median),
           y = base_experience, fill = type_1)) +
  geom_boxplot(outlier.shape = 21,
               outlier.fill = "red",
               outlier.size = 2,
               alpha = 0.7) +
  coord_flip() +  # Flip axes for better readability
  labs(
    title = "Base Experience Distribution by Pokemon Type",
    x = "Pokemon Type",
    y = "Base Experience"
  ) +
theme(legend.position = "none") # Hide legend since fill is just for separation# Save cleaned data
write_csv(pokemon, "pokemon_data.csv")
#Save as Excel (.xlsx)
library(writexl)
write_xlsx(pokemon, "pokemon_data.xlsx")
# Save last plot
setwd("Downloads/")
ggsave("weight_distribution.png", dpi = 300, width = 8, height = 6)
-
Create a plot to compare the Attack stats among Pokemon by their primary type (
type_1). -
Determine the number of Pokemon that Gengar can defeat and present the results in a table.
-
Break down the number of Pokemon Gengar can defeat by their primary type (
type_1) and display the results in a table. -
Identify the most powerful Pokemon and justify your decision using data analysis and visualizations. Support your reasoning with appropriate statistics and plots.