This repository contains solutions to two Python challenges: PyBank and PyPoll. These challenges involve performing data analysis on CSV datasets using Python to generate insights and reports. The project highlights skills in data manipulation, mathematical operations, and generating automated reports.
-
budget_data.csv:
- Contains financial data with two columns: "Date" and "Profit/Losses".
- Used in the PyBank challenge to calculate financial metrics like total months, net profit/loss, and monthly changes in profit.
-
election_data.csv:
- Contains election data with three columns: "Ballot ID", "County", and "Candidate".
- Used in the PyPoll challenge to calculate the total number of votes, percentage of votes for each candidate, and the election winner.
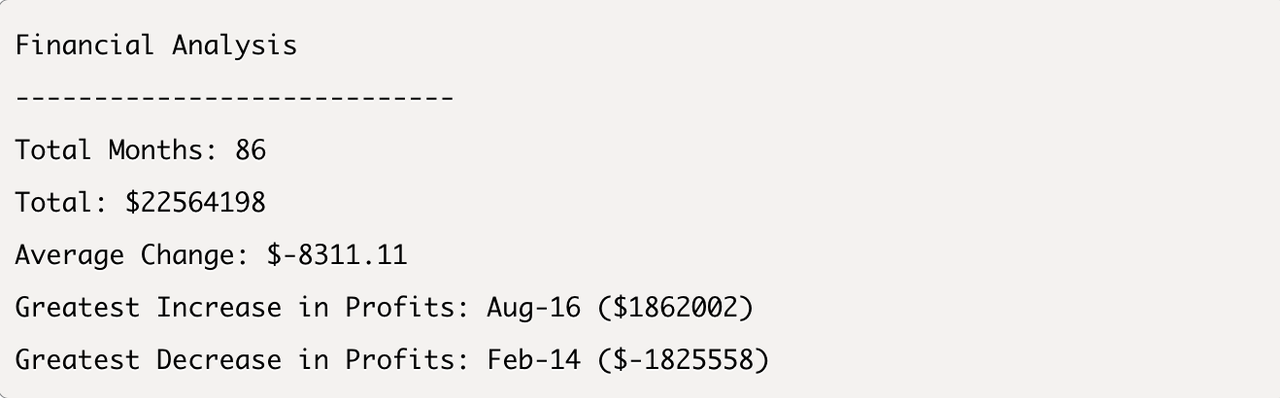
In this task, I analyzed the financial records dataset (budget_data.csv) to generate key financial metrics, including:
- Total months in the dataset
- Total profit/loss over the entire period
- Average monthly change in profit/loss
- The greatest increase in profits (with the corresponding month)
- The greatest decrease in profits (with the corresponding month)
- Data reading and processing using Python's
csvmodule - Iteration over data structures and performing basic math (sum, average, maximum, minimum)
- Writing Python scripts to automate calculations and generate insights
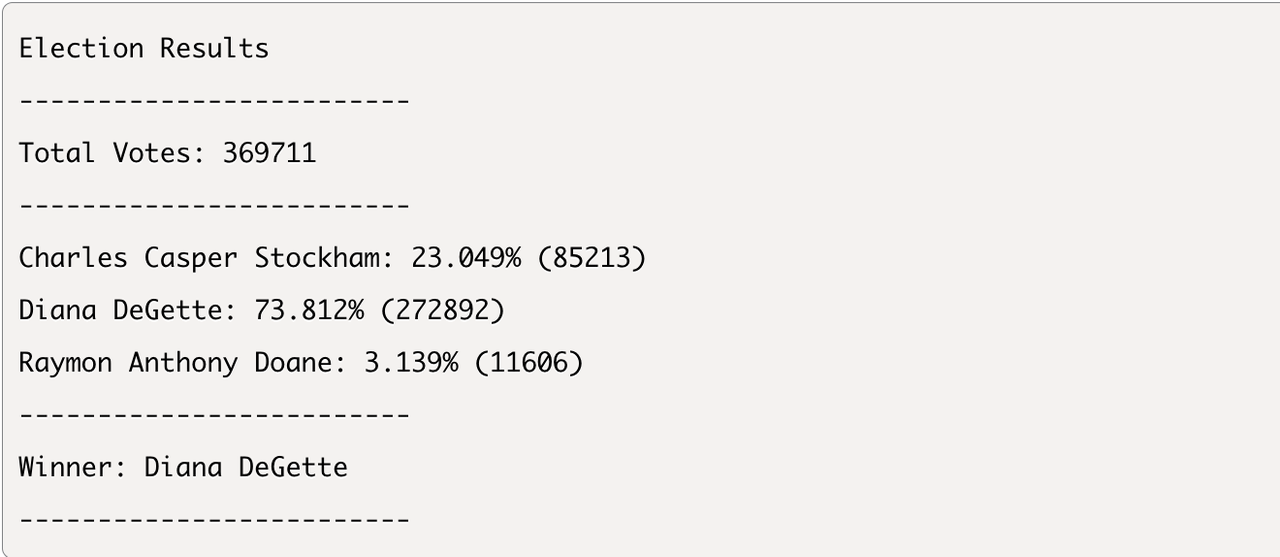
In this task, I analyzed the election dataset (election_data.csv) to calculate voting results, including:
-
Total number of votes cast
-
Vote count and percentage for each candidate
-
Winner based on the most votes
- Parsing and analyzing CSV data
- Calculating percentages and aggregating data
- Identifying the winner using conditional logic
- Exporting results to a text file for reporting
- PyBank:
PyBank_analysis.py: Python script for analyzing the budget data and calculating financial metrics.
- PyPoll:
PyPoll_analysis.py: Python script for analyzing the election data and calculating voting results.
- Python (standard libraries like
csvand file handling) - Data Analysis (Python data manipulation and math operations)
During the development of this project, I utilized ChatGPT as a resource for troubleshooting, refining Python code, and improving my understanding of data analysis techniques.