Pymaceuticals Inc. is a pharmaceutical company developing treatments for squamous cell carcinoma. This project analyzes tumor volume measurements from mice treated with different drug regimens to determine the effectiveness of various treatments. Using Python and data visualization techniques, we clean the dataset, perform statistical analysis, and visualize key findings.
-
The dataset includes tumor volume measurements from mice treated with different drug regimens. The analysis focuses on summarizing key statistical properties, identifying potential data anomalies, and visualizing treatment effectiveness.
-
Data cleaning revealed duplicate mouse IDs with repeated timepoints, which were removed to ensure data integrity. The final dataset contains 248 unique mice after deduplication.
-
Summary statistics of tumor volume for each drug regimen indicate that Capomulin and Ramicane had the lowest average tumor volumes, suggesting potential effectiveness in reducing tumor size.
-
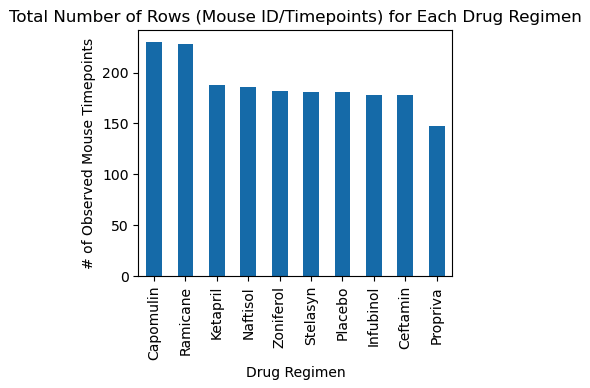
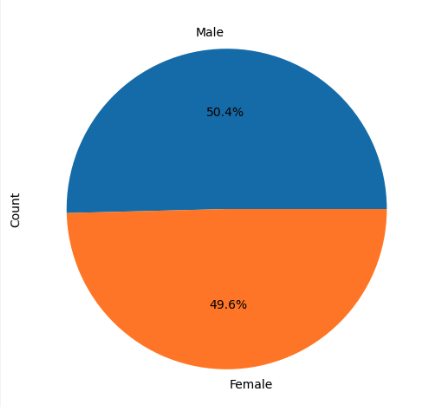
Bar and pie charts visualize the number of observations per drug regimen and the gender distribution of the mice. The study had a nearly even split between male and female mice.
-
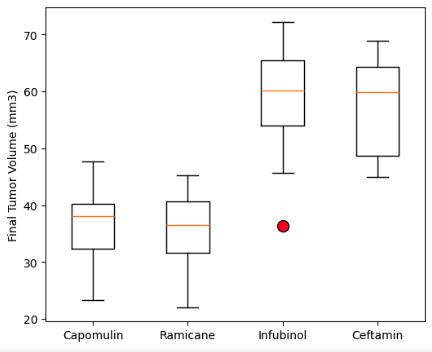
A box plot analysis of tumor volumes for four key drug regimens revealed potential outliers, particularly in the Infubinol and Ceftamin groups, highlighting variability in response to treatment.
-
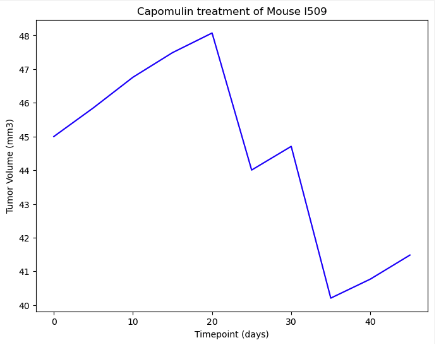
A line plot of tumor volume over time for an individual mouse treated with Capomulin demonstrates a steady decline, suggesting that the drug may be effective.
-
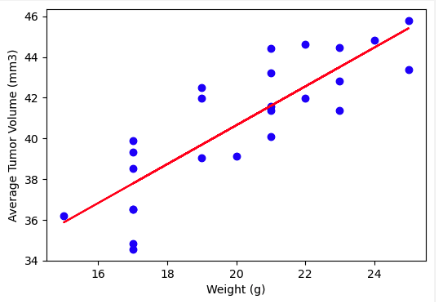
A scatter plot of mouse weight versus average tumor volume for the Capomulin regimen shows a strong positive correlation, which was quantified using Pearson's correlation coefficient.
-
A linear regression model further supports the correlation, with the regression line demonstrating a significant relationship between mouse weight and tumor volume.
Conclusion: The analysis suggests that Capomulin and Ramicane are the most promising treatments, with lower average tumor volumes and a consistent reduction in tumor size over time. However, further testing and statistical validation are necessary to confirm these findings.
- Data Cleaning: Handling missing data, removing duplicates, and ensuring data integrity.
- Exploratory Data Analysis (EDA): Generating summary statistics, identifying anomalies, and creating visualizations.
- Statistical Analysis: Using statistical tests to assess data and establish correlations (e.g., Pearson's correlation).
- Data Visualization: Creating effective plots (e.g., bar charts, pie charts, box plots, scatter plots, line plots) using Matplotlib.
- Regression Analysis: Building linear regression models to quantify relationships in the data.
- Hypothesis Testing: Conducting tests and analyzing data to validate the effectiveness of treatments.
- Python
- Pandas
- Matplotlib
- scipy.stats
- Jupyter Notebook
- Chat GPT