The idea of this repo is to create couple of benchmarks for obtaining some technical data about platform. The C language was chosen for writing the benchmarks due to its proximity to hardware and popularity. Benchmarks are designed for terminal version of execution. Is also possible to connect to remote server using SSH.
Make sure that you have installed gcc compiler. I recomend to use Linux because of comfort of use and availability of interesting options.
This is benchmark for obtaining latency value. Latency is time for execution single scalar operation. Due to data dependencies it's not using pipelining. Execution of instruction n requires instruction n-1 to be executed.

To execute code compile it using high optimization, eg
gcc -O3 latency_scalar.c -o latency_scalarand run the program
./latency_scalar
Quite interesting thing in this (and not only) code is warm up part. Contemporary computers are "smart". To reduce power consumption processor decreases clock frequency. So when we start intense calculations CPU increases its frequency. During code execution. So performance decreases. Check it on your own by commenting warm up loop in code, recompile and execute both versions under perf stat tool.
perf stat ./latency_scalarThis is maximum throughput benchmarking for one logical processor. Different approach gives to the user possibility to declare number of variables to be processed, but it also gives a bit different results than approach used in latency_scalar.c. The reason are different processor's instructions for arrays.
Due to no data dependencies between different variables processor can execute multpile instructions at the same time. Schema of processing looks like this:
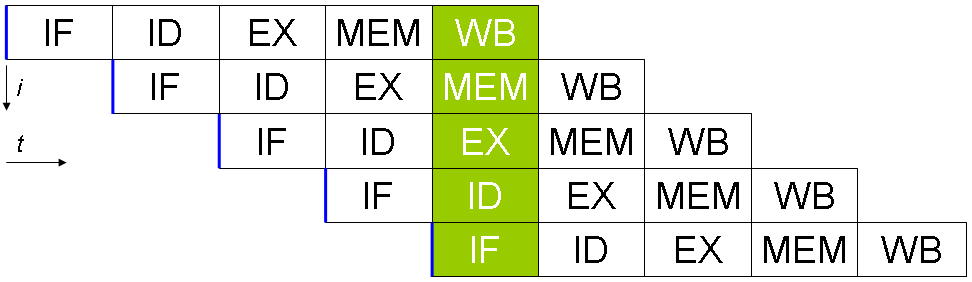
While quantity of variables increases processor can use more pipelines, so performance increases too. Code is written to avoid memory accesses - variables are fetched to registers and stored there for calculations. After reaching certain number of variables decrease of performance was observed due to registers pressure, which is caused by limited registers size.
To obtain higher performance vectorization is required. After passing additional flag to compiler, where microarchitecture is specified, compiler will be more eager to optimize your code (for instance using vectorization), eg
gcc -O3 -march=core-avx2 latency_throughput_scalar_auto.c -o latency_throughput_scalar_autoThis benchmark allows you to calculate cache line size. The idea is to visit (by incrementing) elements in array where next element is located stride elements further. By accessing to an element entire line of cache is filled by next neighbours elements. If stride is larger than quantity of elements in cache line, time per access should change its linear characteristic.
Compile code with -O3 option and run. Program asks you to insert max stride, then press enter.

Copy result to eg Excel and plot stride on X axis, time on Y axis.

Breakpoint is located where stride is equal to 8, so cache line size = sizeof(double) * 8 = 64 [B]