Fresh install of kibana-latest not showing panels #533
Comments
|
Try clearing your browser cache and refreshing |
|
I believe that list is populated from the "panel_names" array in the config.js file. Are the names of the panels still available in your config file?
|
|
Hi! @rashidkpc I've cleared the cache, and I otain the same result. @spenceralger this is my config.js:
|
|
I have update my install to the new latest versione today and panel will showed correctly |
Hi!
I have installed a fresh version of kibana http://download.elasticsearch.org/kibana/kibana/kibana-latest.zip
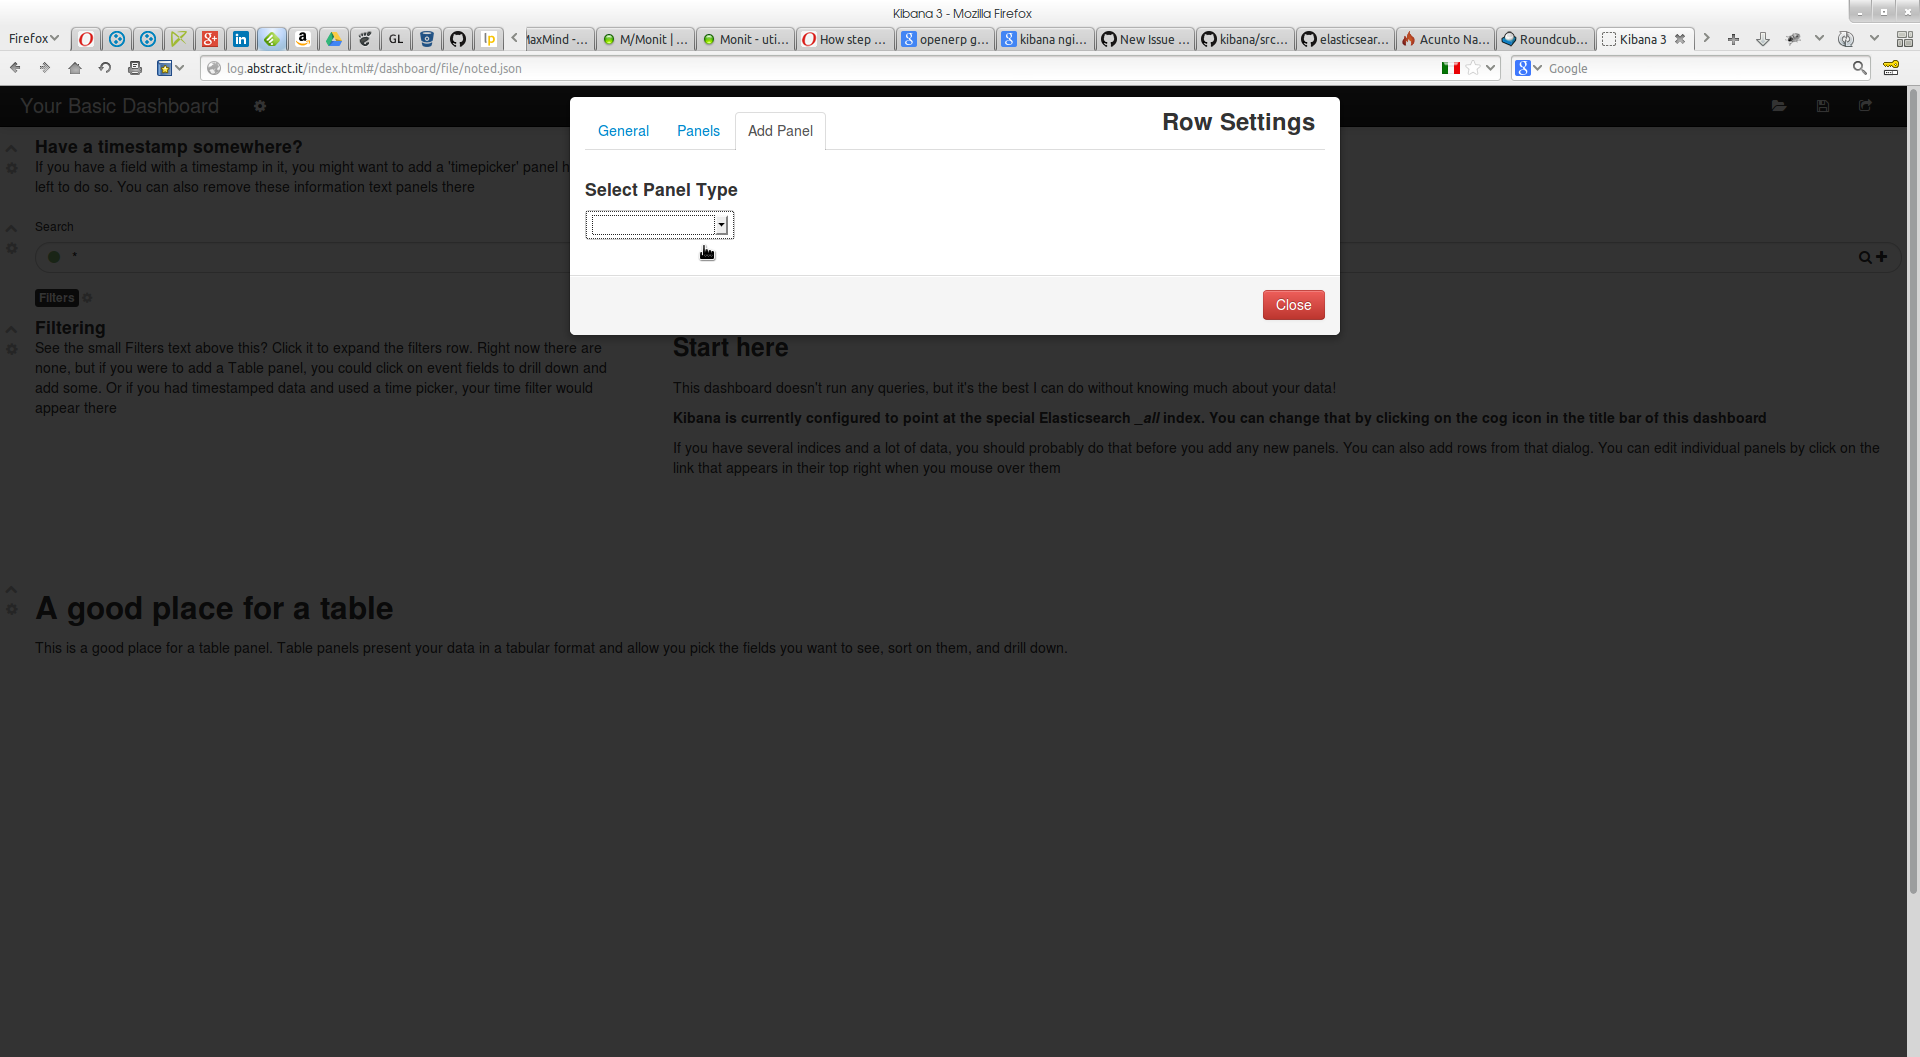
I'm using nginx, and i take the configuration example in this project, but whe I try to add a panel in one of the sample, I see a blank list and I can't select anything (see pic.)
Did someone could help me?
The text was updated successfully, but these errors were encountered: