The threed lib for G2.
Create a renderer and register relative plugins which provides 3D rendering capabilities:
import { Renderer as WebGLRenderer } from "@antv/g-webgl";
import { Plugin as ThreeDPlugin } from "@antv/g-plugin-3d";
import { Plugin as ControlPlugin } from "@antv/g-plugin-control";

const renderer = new WebGLRenderer();
renderer.registerPlugin(new ThreeDPlugin());
renderer.registerPlugin(new ControlPlugin());
Then extend the runtime of G2 with 3D lib:
import { threedlib } from "@antv/g2-extension-3d";
import { Runtime, corelib, extend } from "@antv/g2";

const Chart = extend(Runtime, { ...corelib(), ...threedlib() });
const chart = new Chart({
  container: "container",
  renderer,
  depth: 400,
});
Now we can use 3D marks like this:
chart.point3D().data({});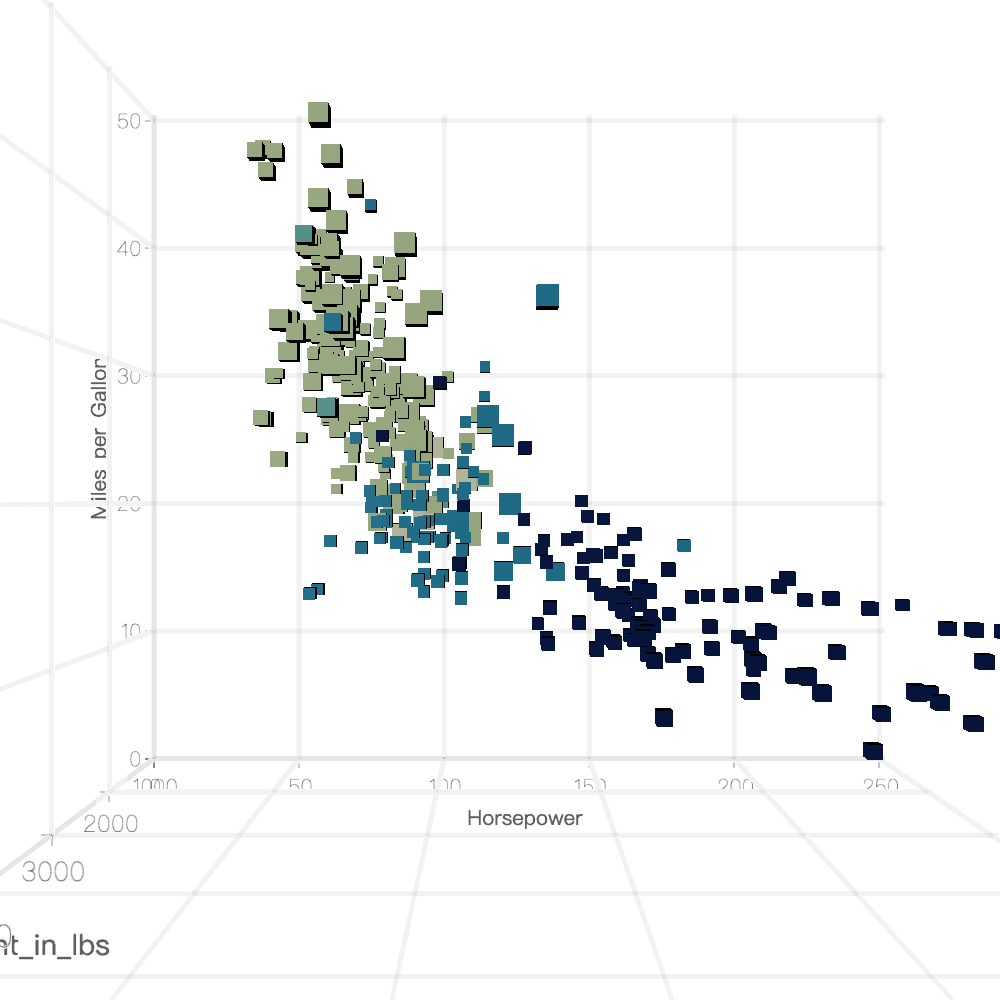
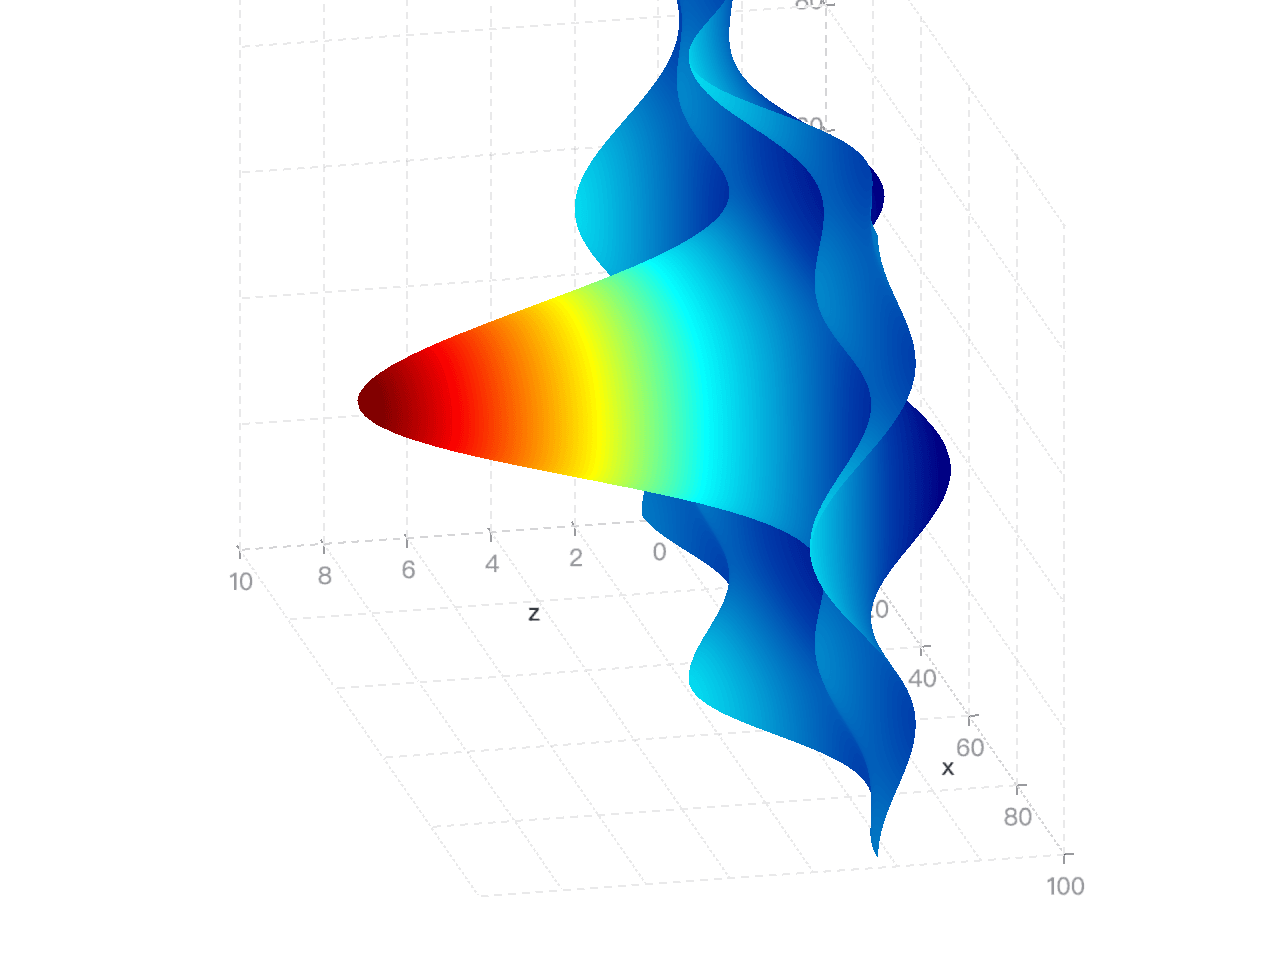
Use surface3D mark:
chart
  .surface3D()
  .data(points)
  .encode("x", "x")
  .encode("y", "y")
  .encode("z", "z")
  .encode("color", "z")
  .coordinate({ type: "cartesian3D" })
  .scale("x", { nice: true })
  .scale("y", { nice: true })
  .scale("z", { nice: true })
  .scale("color", { palette: "spectral" })
  .legend(false)
  .axis("x", { gridLineWidth: 1 })
  .axis("y", { gridLineWidth: 1, titleBillboardRotation: -Math.PI / 2 })
  .axis("z", { gridLineWidth: 1 })
  .style({
    palette: "spectral",
});To run playwright, you must download new browsers first:
$npx playwright install