GOAL - Calculate risk factors for drivers with Spark and utilize Zeppelin to visualize the results -- this demo will produce the same results as Risk Analysis with Pig
PREREQUISITE - Risk Analysis with Pig
SEE ALSO - This demo is based on these two publicly-available Hortonworks tutorials:
RECORDED DEMO
PRIOR DEMO CLEANUP - Cleanup
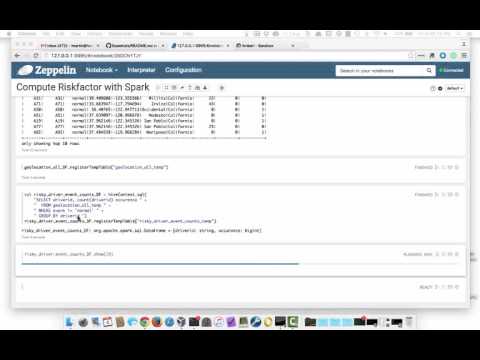
As directed from the Sandbox Splash Page, open Zeppelin by navigating your browser to http://127.0.0.1:9995. Once there, Click on Notebook > Create new note and name it "Compute Riskfactor with Spark".


Get started with adding these Scala imports to your Zeppeline notebook and then clicking the play button (or press Shift+Enter) to run the code.
import org.apache.spark.sql.hive.orc._
import org.apache.spark.sql._
Instantiate HiveContext by adding the next line of code in the next code block window and run this code.
val hiveContext = new org.apache.spark.sql.hive.HiveContext(sc)
NOTE: Continue with this pattern of putting subsequent code in following code block windows (aka paragraphs) to avoid having to rerun any prior coding snippets.
View the list of table available from Hive.
hiveContext.sql("show tables").collect.foreach(println)Load the contents of the geolocation Hive table into a
DataFrame for use within Spark.
val geolocation_all_DF = hiveContext.sql("SELECT * FROM geolocation")Display its results.
geolocation_all_DF.show(10) Register this DataFrame so it can be used within SQL statements.
geolocation_all_DF.createTempView("geolocation_all_temp")Filter out the drivers who only have "normal" driving events and calculate the count of risky events for each remaining driver. Then register this new DataFrame to allow subsequent SQL operations.
val risky_driver_event_counts_DF = hiveContext.sql(
    "SELECT driverid, count(driverid) occurance " +
    "  FROM geolocation_all_temp " +
    " WHERE event != 'normal' " +
    " GROUP BY driverid ")
risky_driver_event_counts_DF.createTempView("risky_driver_event_counts_temp")
Review these results.
risky_driver_event_counts_DF.show(10)NOTE: You can do this from the DataFrame API as well instead as a query.
geolocation_all_DF.filter("event != 'normal'").
    groupBy("driverid").count().withColumnRenamed("count", "occurance").
    show(10)
NOTE: To conserve resources in the notebook, use the "Clear Output" functionality that is available by clicking on the gear icon in upper-right corner of this paragraph and then selecting "Clear Output" as shown in the following screenshot.

Now, join the temporary table that holds the risky drivers and their
counts with Hive's driver_mileage table created in
Risk Analysis with Pig, then store that DataFrame
as a temporary table.
val joined_DF = hiveContext.sql(
    "SELECT rd.driverid, rd.occurance, dm.totmiles " +
    "  FROM risky_driver_event_counts_temp rd, driver_mileage dm " +
    " WHERE rd.driverid = dm.driverid")
joined_DF.createTempView("joined_temp")
Review the results of the join.
joined_DF.show(10)Again, you can alternatively do this with the DataFrame API. Notice
that we did have to get the driver_mileage table into a DataFrame.
val driver_mileage_DF = hiveContext.sql("SELECT * FROM driver_mileage")

risky_driver_event_counts_DF.join(
    driver_mileage_DF,
    risky_driver_event_counts_DF("driverid") === driver_mileage_DF("driverid"),
    "inner").drop(driver_mileage_DF.col("driverid")).
    show(10)
NOTE: As before, use the "Clear Output" functionality on this unwanted paragraph.
Create a new DataFrame than contains, by driver, the risk calculation of total miles driven divided by the number of risky events. Register this as a temporary table and dump the contents to the notebook.
val risk_factor_calc_DF = hiveContext.sql(
    "SELECT driverid, occurance, totmiles, totmiles/occurance riskfactor " +
    "  FROM joined_temp")
risk_factor_calc_DF.createTempView("risk_factor_calc_DF")
risk_factor_calc_DF.show(20)
Create a new table similar to the risk_factor one created in
Risk Analysis with Pig to saved the newly
calculated risk values from Spark.
hiveContext.sql(
    "CREATE TABLE risk_factor_spark( " +
    "   driverid String, events bigint, totmiles bigint,riskfactor double) " +
    "STORED AS ORC")
Verify from the Hive View (logged in as admin is fine) this table has been
created and is empty.
Since we created this table to be backed by the ORC file format, we need
to persist risk_factor_calc_DF to disk in that format.
risk_factor_calc_DF.write.format("orc").save("risk_factor_calc_ORC")Verify from the HDFS Files View that this information was persisted.

Load the data into Hive.
hiveContext.sql(
    "LOAD DATA INPATH 'risk_factor_calc_ORC' " +
    "INTO TABLE risk_factor_spark")
Verify it made by querying from Hive View.

In a fresh paragraph, add the following query and execute it.
%sql

SELECT * FROM risk_factor_spark
Explore the various charts that are available from the toolbar highlighted below.

Choose the Bar Chart icon, click on settings next to the toolbar, and then set driverid in the
Keys field and riskfactor in the Values field to see the peaks and
valleys of ranges amongst drivers.

NOTE: As before, click on "Clear output" to free up visual space and system resources. Additionally (especially on prior versions of the Sandbox), it may become necessary to use Ambari to stop and start services. Ideally, shutdown Zeppellin and then Spark and start them up in reverse order.
Run another query to visualize against after creating a new notebook.
%sql

SELECT r.driverid, r.riskfactor, g.city, g.state
  FROM risk_factor_spark r, geolocation g
 WHERE r.driverid = g.driverid
This time pick the right-most icon in the toolbar select:
driveridfor xAxisriskfactorfor yAxiscityfor groupriskfactorfor size

This is just a quick intro to the types of visualization opportunities that exist with Zeppelin.